Winch Power Draw Calculator
Estimate winch amps, watts, battery amp-hours, alternator support, cable voltage drop, line-layer derating, and motor rest time for camper, truck, SUV, and overland recoveries.
Calculation breakdown
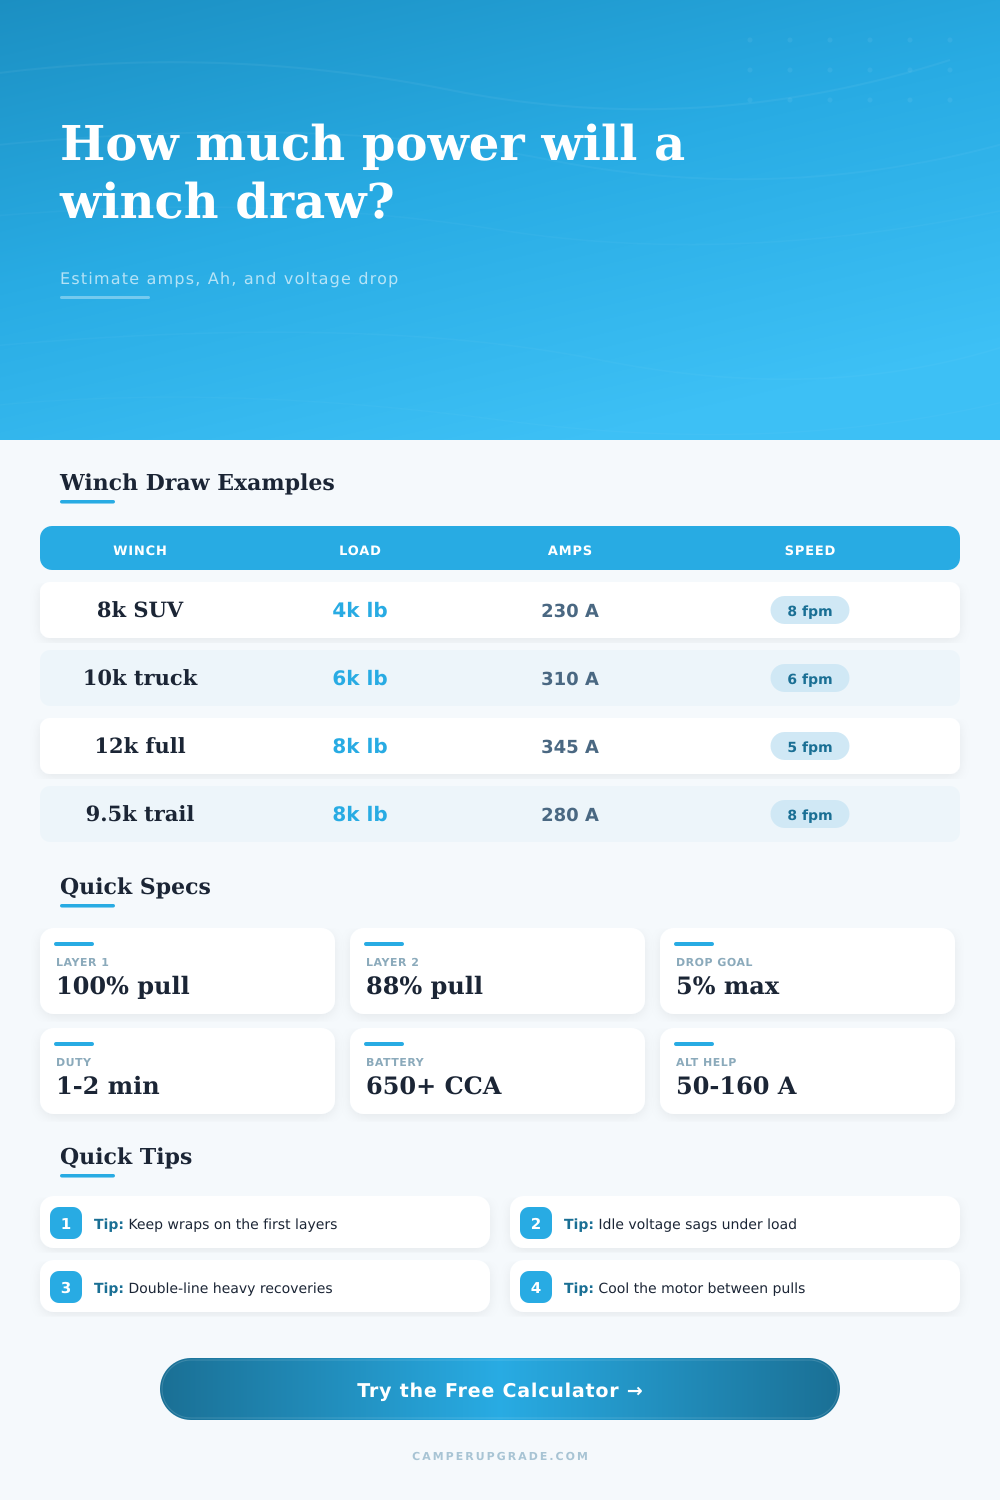
| Winch curve | Rated pull | No-load amps | Mid-load amps | Full-load amps |
|---|---|---|---|---|
| WARN VR EVO 8-S | 8,000 lb | 70 A | 260 A at 4,000 lb | 420 A |
| WARN VR EVO 10-S | 10,000 lb | 70 A | 300 A at 6,000 lb | 450 A |
| WARN VR EVO 12-S | 12,000 lb | 75 A | 335 A at 8,000 lb | 470 A |
| COMEUP Seal Gen2 9.5rs | 9,500 lb | 60 A | 245 A at 6,000 lb | 380 A |
| COMEUP Seal Gen2 12.5rs | 12,500 lb | 45 A | 300 A at 8,000 lb | 470 A |
| Layer | Pull factor | Speed factor | What it means |
|---|---|---|---|
| Layer 1 | 100% | 1.00x | Highest rated pull, slowest line speed, best for hard recoveries. |
| Layer 2 | 88% | 1.12x | Common after a few wraps remain on the drum. |
| Layer 3 | 78% | 1.25x | More rope on the drum reduces torque margin. |
| Layer 4 | 70% | 1.38x | Use caution for heavy pulls; consider a block. |
| Layer 5 | 64% | 1.50x | Near-full drum, fastest rope travel, lowest pull margin. |
| Cable size | Ohms / 1000 ft | 300 A drop over 12 ft round trip | Typical winch use |
|---|---|---|---|
| 4 AWG | 0.2485 | 0.89 V | Short moderate pulls only; drop rises quickly. |
| 2 AWG | 0.1563 | 0.56 V | Light winch or short front-battery cable. |
| 1/0 AWG | 0.0983 | 0.35 V | Common heavy winch battery leads. |
| 2/0 AWG | 0.0779 | 0.28 V | Useful for high-current truck and camper setups. |
| 4/0 AWG | 0.0490 | 0.18 V | Long rear battery runs or severe high-current pulls. |
| Recovery setup | Typical load | Electrical behavior | Planning note |
|---|---|---|---|
| Light SUV rolling assist | 2,000 to 4,000 lb | Low to mid curve amps, short rests. | Single line is often enough if the first layer is available. |
| Loaded van in sand | 5,000 to 8,000 lb | High current and noticeable voltage sag. | Use short pulls and watch battery voltage. |
| Truck camper in mud | 7,000 to 12,000 lb | Near full-load amps on many 10k to 12k winches. | Double-line to reduce motor current and heat. |
| Steep trailer repositioning | 4,000 to 9,000 lb | Longer motor-on time can dominate Ah use. | Duty cycle matters more than peak current alone. |
| Repeated trail recoveries | Varies by pull | Motor, solenoid, cable, and battery heat stack together. | Use longer rests as the system warms up. |
Effective winch load = hook pull / line parts / line-layer pull factor.Curve amps are interpolated from first-layer amp points, then adjusted for loaded voltage and safety margin.Battery Ah used = max(0, peak amps - alternator amps) x pull seconds / 3600.Cable drop = peak amps x copper resistance x round-trip cable feet / 1000, plus connection allowance.
This calculates voltage drop, battery drain and amp draw of your winch configuration. It turns a potentially stressful recovery situation into a set of numbers. Simply plug in your cable spec, winch model and estimated load, and let the calculator do the work. Now you know what your electricals is capable of during a time of need.
One additional overlooked variable in any recovery is the rope layer on the drum. As the drum becomes near empty, the winch will pull slower, not simply because the speed decreases but also because it’s a leverage issue. The effective radius of the drum change as the rope spools up onto higher layers. This results in a different gear ratio which means the motor must spin faster at the same line pull. Thus the current draw increase dramatically for the same hook load. This geometry is one reason why the calculator factors in the layer derating. It reveals how much more the system is stressed when pulling from the top of drum. This has important electrical effects that cannot be ignored.
Know Your Winch Limits
Though batteries seem like unlimited sources of energy, they’re not. They have limits, especially on chemistry. When your winch pulls three hundred amps from a standard starting battery, it use up what’s left in just a few seconds. At this point, an alternator can’t rescue you. Alternators typically supply about fifty or one-hundred amps to help recharge your battery. That’s hardly enough for a major tug. Your battery can only do so much; it has to replenish itself before attempting another large pull.
When the calculator show a large percent of your amp-hours being burned during use, you should stop. Allow battery to refill before proceeding. If you don’t let the battery recover, you risk a dead battery at the worst possible moment.
The other key element here is cable voltage drop. Thicker gauge cable cost more money and is harder to run, so many folks just get minimum recommendation for their setup. Keep in mind length plays a role in this equation. Two-gauge cable used on a 6′ run is not going to behave like that same 2 gauge on a 10′ run. Voltage gets consumed along the way as it faces resistance which will be cumulative by the time it hits the motor. Lower voltage mean the motor has to pull more amps to create the same amount of torque. It becomes a feedback loop of poor performance and heat. Your amp draws will increase. No matter what battery you have, there is no way to fix that kind of inefficiency if you are experiencing too much voltage drop. The chart below show how various sizes perform at varying loads.
For trail use, maybe the most applicable output from the calculator is duty cycle. Winches aren’t meant to be run continuously; they’re made for brief spurts. Burning out motor windings by pushing a hot winch harder trying to save a few seconds wont get you anywhere. Depending on thermal load and how long you pulled, it will tell you when it’s time to cool down. That’s based off the physics of cooling down. If you don’t heed this recommendation, you risk melting solenoids or burning out motor windings.
There’s no single “winch”, it’s really an electrical chain that has bottlenecks all along the way. That’s where this tool comes into play; which link is your weak point? The weak points are load, heat, and voltage. What do those numbers mean? Why don’t you know yet? Why are you still guessing? When you do, you can pull confidently and be sure knowing why.
Know before you engage. You should of known before a dead battery on a line at the worst time. Do the math.