Trail Effort by Grade Calculator
Estimate how trail grade changes hiking effort, adjusted miles, climb load, descent strain, pace, calories, and elapsed trip time.
1.Trail presets
2.Trail inputs
Planning note: This calculator is a route planning model. Weather, navigation, altitude acclimatization, trail closures, exposure, and individual fitness can change real effort.
Trail effort results
3.Grade effort reference
4.Grade and pace table
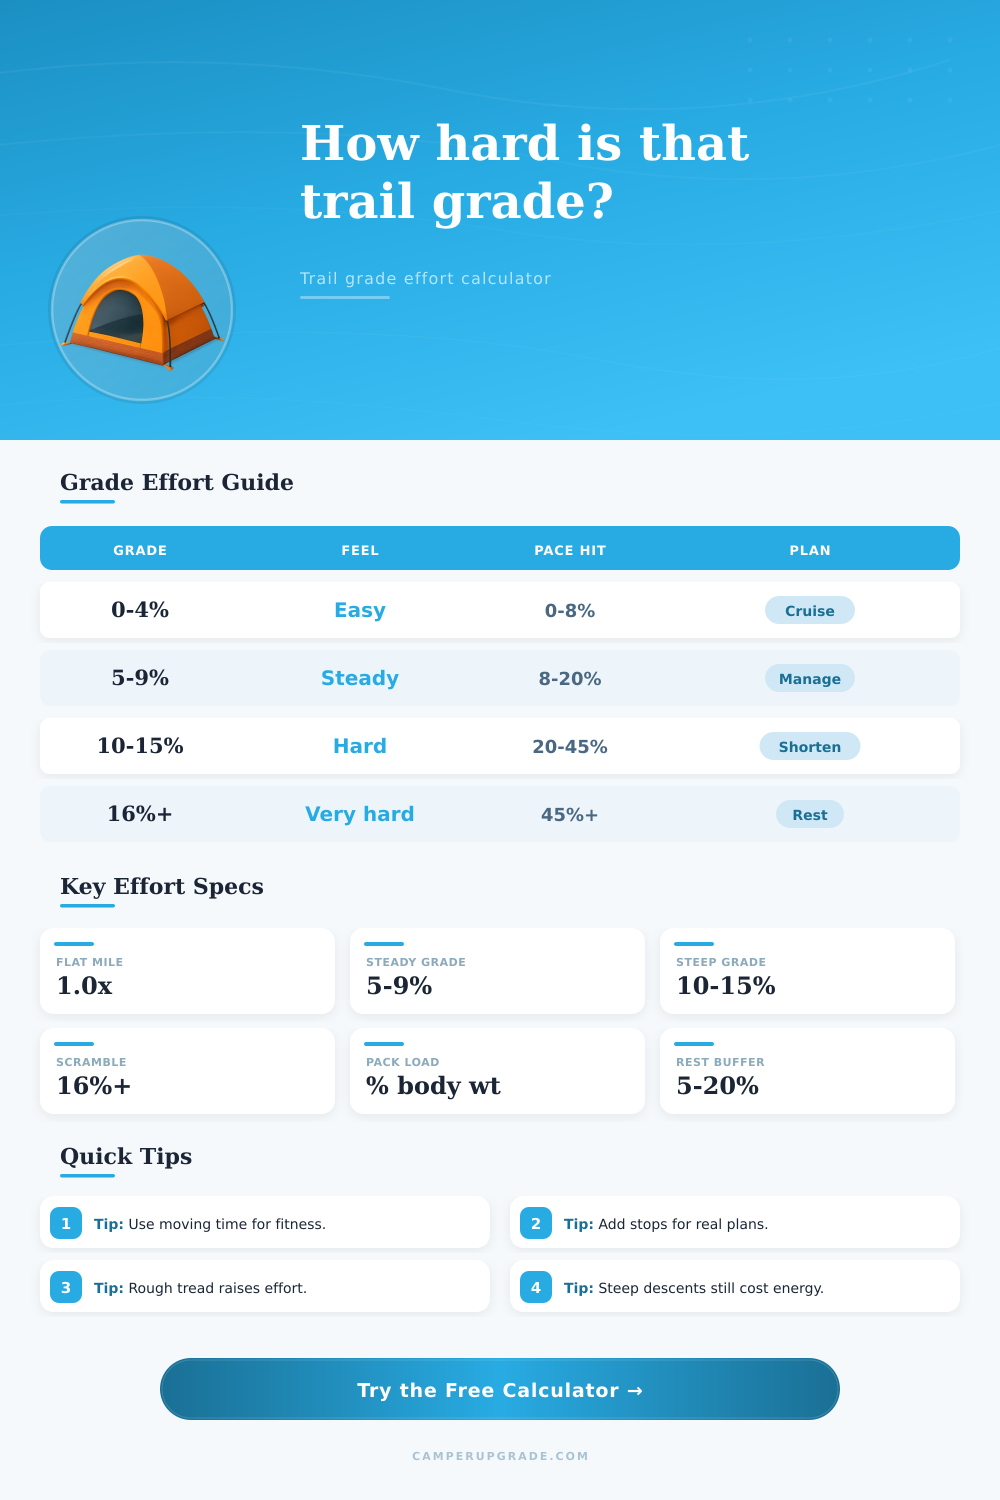
| Average grade | Typical feel | Common trail example | Pace penalty | Planning move |
|---|---|---|---|---|
| 0 to 4% | Easy to moderate | Lakeside path, rail trail, meadow approach | 0 to 8% | Use normal moving pace |
| 5 to 9% | Steady aerobic climb | Switchback climb, ridge approach, rolling forest loop | 8 to 20% | Add a modest time buffer |
| 10 to 15% | Hard sustained climbing | Pass approach, canyon exit, steep dirt trail | 20 to 45% | Shorten daily mileage or add breaks |
| 16 to 25% | Very hard and stop-start | Direct ascent, rough steps, alpine approach | 45 to 85% | Plan by vertical gain more than miles |
| 25%+ | Hands-on or scramble territory | Loose chute, boulder field, snowy gully | Route specific | Check traction, exposure, and turnaround time |
5.Adjustment factors
| Factor | Low setting | Middle setting | High setting | Why it matters |
|---|---|---|---|---|
| Pack load | 0 to 10% body weight | 11 to 25% body weight | 26%+ body weight | Load raises energy cost and slows steep climbing. |
| Surface | Smooth path | Maintained dirt | Loose rock, mud, snow | Foot placement and traction change both pace and effort. |
| Altitude | Below 5000 ft | 5000 to 9000 ft | 9000 ft+ | Less oxygen reserve reduces sustainable pace. |
| Temperature | 45 to 75 F | 30 to 44 F or 76 to 85 F | Below 30 F or above 85 F | Clothing, water, heat stress, and cold stops affect plans. |
6.Common trail scenarios
| Scenario | Distance | Gain | Average grade | Planning note |
|---|---|---|---|---|
| Gentle campsite connector | 2 mi | 150 ft | 1.4% | Usually pace-limited by group stops, not grade. |
| Rolling lake loop | 5 mi | 700 ft | 2.7% | Short climbs add effort even when average grade looks mild. |
| Forest ridge trail | 7 mi | 1800 ft | 4.9% | Expect steady breathing and a noticeable time penalty. |
| Canyon exit hike | 4 mi | 2200 ft | 10.4% | Grade dominates the day; plan water and breaks carefully. |
| Alpine approach | 6 mi | 3300 ft | 10.4% | Altitude, pack load, and rough tread stack quickly. |
The number of miles on a trail map seems straightforward enough when you read it, but as anyone who has walked knows, your legs has another story to tell. Seven miles across flat land feels different than seven miles with up and down all day long. Not only does it take longer but it also wear you out more by the end.
That’s what the adjusted number in this calculator above converts. It make the numbers you see side-by-side comparable even before leaving home. Those are there because they’re all variables that affects the amount of effort your body expends.
Why Real Walking Distance is Different from Map Distance
The base is distance. You can factor in elevation gain, which adds a climb cost that grow faster than most people expect once grades pass about five percent. And elevation loss… Steep downhills put stress on the knees and quads with each impact and also tend to slow your stride. Then there’s pack weight, which compounds the calories spent per step on each upward push.
Finally, we have you: Body weight give the ratio from which the calculator determine if your load is light, moderate, or heavy. Same with surface: Loose rock or soft sand forces smaller steps and more balance work; and high altitude reduce the oxygen available for sustained effort. Temperature has a thing going on all its own: It makes you want to stop for extra water breaks, or change clothes, which stretches time clock even if your moving speed remains unchanged.
Direction setting take into account that repeated short uphill slogs take longer than one big slog up the exact same amount. The same is true for steady downhill routes, which will be easier then ones that roll up and back down again and again.
With the numbers entered, it outputs an adjusted distance. This distance factors in altitude, surface, and load, as well as grade, into one number. So if the adjusted number is higher than what you see on the map you know this will be a longer day than expected and can use that information to help decide whether to tack on a side trip or choose between two route.
The effort band allow you to quickly understand where this day falls in comparison to other days out… Without having to convert raw numbers as you go. That said, there are some judgment calls that is outside the calculator’s wheelhouse (and these are still part of proper trip planning). A moderate day might be turned into a slow one when it gets rainy or windy; also, a group’s collective fitness level tends to set actual pace much better than any individual grade.
Time spent on unplanned photo stops, navigation errors, and finding routes on faint trails: these don’t fit into any perfect formula. But the beauty of the adjusted number is that it begins the conversation from a realistic place rather than a rosy one.
Ultimately, you’ll just want to know whether your chosen route matches the energy and time you have for it or if it should of been a different plan.