Temperature Lapse Rate Calculator
Estimate target mountain temperature, temperature change, freezing level, and a practical layering alert from starting elevation, starting temperature, target elevation, lapse rate, humidity, inversion risk, wind exposure, time of day, and forecast offset.
Mountain temperature estimate
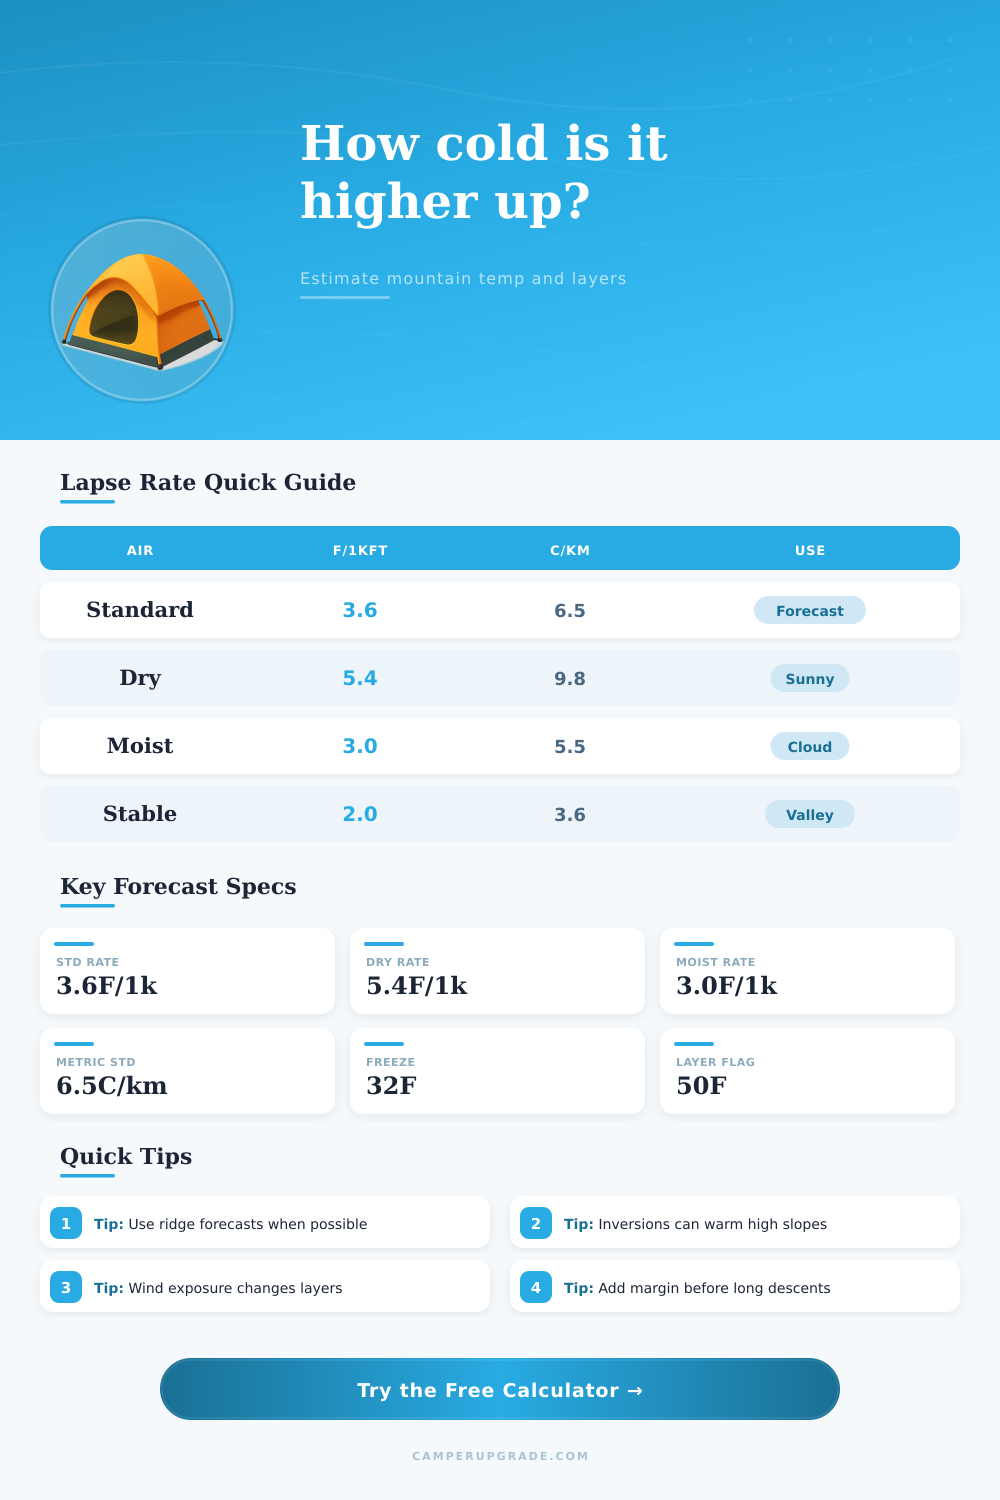
| Lapse type | Imperial rate | Metric rate | Best forecast use |
|---|---|---|---|
| Standard atmosphere | 3.6 F per 1,000 ft | 6.5 C per 1,000 m | General forecast translation between nearby elevations. |
| Dry adiabatic | 5.4 F per 1,000 ft | 9.8 C per 1,000 m | Sunny, well-mixed air below cloud base or in dry desert mountains. |
| Moist or saturated | About 2.7 to 3.5 F per 1,000 ft | About 5 to 6.5 C per 1,000 m | Cloudy, humid, foggy, or precipitation-producing layers. |
| Stable layer | About 1.5 to 2.5 F per 1,000 ft | About 2.7 to 4.5 C per 1,000 m | Weak mixing, smoke layers, cold valleys, or gentle overnight gradients. |
| Inversion | Can reverse the sign | Can reverse the sign | Valley cold pool with warmer air on benches, ridges, or upper slopes. |
| Target temperature | Sheltered travel | Open slope or ridge | Layering note |
|---|---|---|---|
| 60 F / 16 C and warmer | Light sun layer | Wind shirt may still help | Watch dehydration and sun exposure. |
| 45 to 59 F / 7 to 15 C | Light fleece or active layer | Wind shell plus active insulation | Common shoulder-season ridgeline zone. |
| 32 to 44 F / 0 to 7 C | Warm active layer | Insulation, shell, gloves, warm hat | Cold rain or wet snow can change risk quickly. |
| 15 to 31 F / -9 to 0 C | Winter layers | Face, hand, and emergency insulation | Long stops require a real belay or camp layer. |
| Below 15 F / -9 C | Expedition-style cold margin | Full winter kit and conservative turnaround | Small forecast errors become large comfort errors. |
| Adjustment input | Typical sign | Calculator treatment | When to use caution |
|---|---|---|---|
| Humidity | Higher humidity usually slows cooling with height | Auto mode blends dry, standard, and moist rates. | Showery weather can vary sharply by slope and hour. |
| Valley inversion | Upper slopes can be warmer than the valley | Adds a warming correction for target terrain above the cold pool. | Breakup after sunrise can erase the inversion quickly. |
| Wind exposure | Air temp unchanged, comfort colder | Raises the layering alert level without changing air temperature. | Ridges, passes, saddles, and lake basins are often harsher. |
| Time of day | Midday warmer, night colder | Adds a simple solar or cooling offset. | Cloud cover, aspect, forest cover, and storms can override it. |
| Forecast offset | User-defined warm or cold correction | Adds directly to the target estimate. | Use official high-elevation forecasts when available. |
| Freezing level position | What it implies | Trail surface cue | Planning note |
|---|---|---|---|
| Below start elevation | Whole route may remain near or below freezing | Ice, firm snow, frozen mud | Plan traction and warmer stops. |
| Between start and target | Route crosses the freeze line | Wet-to-frozen transition possible | Expect changing footing with elevation. |
| Near target elevation | High point sits close to freezing | Rime, graupel, sleet, or icy wind | Small forecast errors matter. |
| Above target elevation | Estimated route stays above freezing | Mostly liquid precipitation if wet | Night cooling can still refreeze surfaces. |
| No crossing in range | Model never reaches 32 F nearby | Use direct forecast values | Check actual summit and pass reports. |
| Scenario | Start to target | Likely lapse choice | Forecast takeaway |
|---|---|---|---|
| Campground to pass | 4,000 ft to 9,000 ft | Standard or moist | Expect roughly 15 to 20 F of cooling before local offsets. |
| Desert trailhead to summit | 2,000 ft to 7,500 ft | Dry sunny air | Large cooling aloft, but sun and exposure remain strong. |
| Coastal mountain ridge | 500 ft to 4,500 ft | Moist or standard | Cloud base and wind matter more than the simple rate. |
| Ski tour valley to bowl | 6,500 ft to 10,500 ft | Stable or inversion | Valley may start colder than upper slopes before mixing. |
| High camp to summit push | 11,000 ft to 14,000 ft | Standard or dry | Wind exposure and nighttime timing drive the clothing margin. |
Temperature change as you increase your elevation due to air expand as it drops in pressure. The rate of cooling with altitude is not a constant figure but instead change with factor like humidity, sunlight exposure, air mass stability, and valley inversion. An valley inversion occur when cold air get trapped in a valley, and these inversion can cause the upper slope to be warmer than the calculation suggest.
Weather condition change the temperature at elevations, so it is essential to consider these factor. By entering your starting elevation, your starting temperature, and the elevation that you plan on reach into the calculator, we can provide you an estimate of the temperature at your higher elevation. The calculator will ask for the type of air mass that you will encounter.
How Temperature Changes as You Go Up the Mountain
For dry air mass, the air cool at a faster rate than moist air masses. This is because dry air masses have strong mixing of air under clear sky conditions. Moist air masses lose heat to water vapor condensing out of the air, losing heat, and cooling at a slower rate.
The auto setting for air masses will allow the calculator to determine your humidity percentage and blend the dry and moist air mass rate. Elevation gain is only one of the factors that will determine how temperature affect you on the mountainside. Wind will affect how temperature affect you.
Wind will not change the air temperature around you. However, wind will increase the rate of heat loss from your body to the air. The calculator will produce a layering alert for you that does not give you the second temperature reading.
This alert will tell you what clothing to pack such as a shell, gloves, or warmer stop layer. Midday sun may warm your mountain location on south facing slopes. If you plan to travel on these slope during the daytime, the temperature may warm.
Additionally, traveling at night will expose you to radiative cooling from the environment. The calculator will provide you with estimate of the freezing level. The freezing level will tell you if there is a 32-degree line between your starting and your target elevation.
If there is a 32-degree line between your elevations, your area may change from wet surface to frozen surfaces. This information is essential for determining your traction choice and how much margin you need to allow for slow movement up the mountain on these slopes. The result of the calculator is an estimate of the temperature at your higher target elevation.
The result of the calculator is not a guarantee of the mountain temperature that you will experience. Any small error in the lapse rate and the inversion of the air masses will grow larger with the difference in your elevations. To account for this, the calculator will show you the temperature in two different unit.
The forecast offset will allow for you to change the temperature if you have another source of information. Run the temperature calculator with different setting for lapse rates before you begin your hike up the mountain. By comparing the standard atmosphere to the moist air case and the dry air case, you can get an idea of how the target temperature and the freezing level will change.
By comparing these settings, you can determine how the target temperature and the freezing level will change based off the air mass that move through your hiking area. The temperature calculator will not replace the weather forecast for your hiking area. However, it will help change a vague idea of the temperature to a specific number.
This will allow you to make a decision on how many clothing layer to wear before you begin to hike uphill.