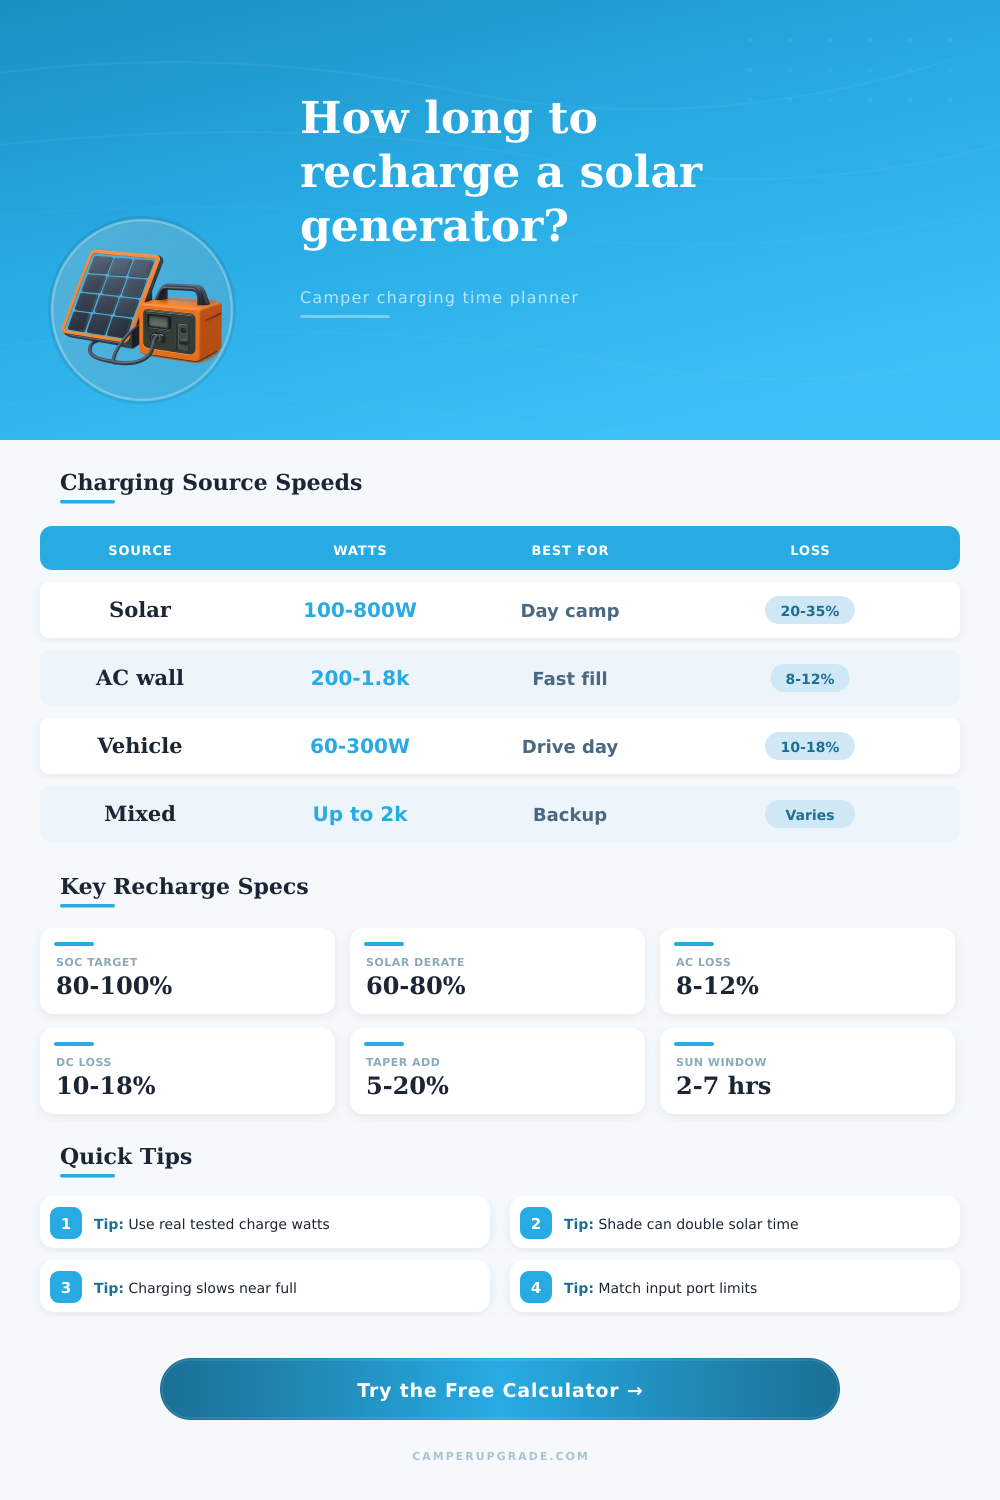
Solar Generator Recharge Time Calculator
Estimate camper recharge hours from battery size, state of charge, solar panels, shore power, vehicle charging, and real-world loss factors.
| Condition | Use Output | 200 W Daily Wh | Best Entry |
|---|---|---|---|
| Clear, aimed panels | 75-85% | 750-850 Wh at 5 sun h | 80% derate |
| Good camp sun | 65-75% | 650-750 Wh at 5 sun h | 70% derate |
| Hazy or hot panels | 50-65% | 500-650 Wh at 5 sun h | 58% derate |
| Partial shade | 25-50% | 250-500 Wh at 5 sun h | 40% derate |
| Winter low sun | 35-55% | 210-330 Wh at 3 sun h | 45% derate |
| Source | Typical Input | Time Formula | Camper Use |
|---|---|---|---|
| Portable solar | 100-800 W rated | Wh / (watts × derate) | Quiet daytime recovery |
| AC shore charger | 200-1800 W | Wh / (watts × efficiency) | Fast campground refill |
| 12 V vehicle port | 60-120 W | Wh / (watts × efficiency) | Small stations while driving |
| DC-DC vehicle input | 150-600 W | Wh / (watts × efficiency) | Van or tow vehicle charging |
| Mixed sources | Sum of active inputs | Wh / combined effective W | Recovery during short stays |
| Capacity | 20% to 90% | 200 W Solar at 70% | 600 W AC at 90% |
|---|---|---|---|
| 500 Wh | 350 Wh | 2.5 h sun | 0.6 h |
| 750 Wh | 525 Wh | 3.8 h sun | 1.0 h |
| 1,000 Wh | 700 Wh | 5.0 h sun | 1.3 h |
| 1,500 Wh | 1,050 Wh | 7.5 h sun | 1.9 h |
| 2,000 Wh | 1,400 Wh | 10.0 h sun | 2.6 h |
| 3,000 Wh | 2,100 Wh | 15.0 h sun | 3.9 h |
| Scenario | Battery Gap | Likely Source | Planning Note |
|---|---|---|---|
| Weekend lights and phones | 250-400 Wh | 100 W solar | Often one sunny day |
| Fridge and fan recovery | 450-800 Wh | 160-300 W solar | Watch morning shade |
| Remote work day | 900-1,500 Wh | 400 W solar plus AC | Mixed charging helps |
| Drive day refill | 500-1,200 Wh | 120-240 W DC | Needs long drive time |
| Large basecamp station | 1,500-2,500 Wh | 600 W solar or AC | Panel input limit matters |
When you have just six hours of camping left and your solar generator reads 20 percent battery life, it’s natural to freak out, but typically, the math is simple enough not to cause panic. Your phone, fan, and lights all require juice so learning about their fill time can transform experience from a scramble to a routine exercise. Guessing becomes planning, and identifying that deficit is half the battle.
The key difference is the energy gap. Charging up to a certain level, say 100%, vs. It replaces energy that has already been used. This means less work to do when your starting point is not at zero, since a device with a capacity of two thousand watt-hours beginning at twenty percent would require a thousand six-hundred watt-hours to charge fully. A calculator will do these calculations for you. It takes into account the gap between where you are now and wherever you want to be, rather than total battery capacity. Most people mistakenly believe total capacity determines how much energy they need, which lead them to overestimate.
How to Plan Your Battery Charge Time
A two-hundred-watt panel doesn’t usually put out two hundred watts into your battery. Solar power makes sense until you factor in the real world. Angle, dust, and heat decreases output. Environmental conditions combined with inefficiency of controllers can knock output down to sixty or seventy percent of what they is rated for. It is important to know the derate. The plan fails if they assumes the system performs at its best on a hot afternoon. The plan succeeds if they adjust input based off realistic percentage yields.
AC charging can be done using shore power, outlets in campgrounds give you constant raw watts regardless of weather conditions. But there are inefficiencies: To convert AC to DC, some gets lost as heat. Moddern inverters usually sit between 88 and 94 percent efficient, so while not perfect, it’s still fast. If your boat supports it (often the case), adding a solar charge source means you’re able to tap into both at once, making it often the smartest strategy when staying longer than a day or two and sun hours is low.
Another possibility is vehicle charging. This works particularly well if you’re taking your car out anyway, as most vehicles feature some kind of DC-DC charger or even just a twelve-volt charging port that provides a trickle charge while on the go. While it’s lower wattage, usually anywhere between sixty and three hundred watts, it add up during a lengthy drive thanks to all those miles of free energy produced by movement. It won’t refill your battery within the hour, but it will offset power consumed while traveling, and it’s perfect for topping things off before you arrive.
Battery Management System (BMS) throttles charge as the lithium battery nears full to maintain cell life. This tapers the charge and messes with estimates. A few thing take much longer at the end; the final 10% of the charge is disproportionally slower then the previous 90%. Users who don’t understand that gets frustrated when their batteries takes longer than expected, but adding in a little padding for the charge taper helps calibrate projection times. Explicitly showing the changing charging rate on reference tables also helps clarify how various sources will behave under specific conditions.
Power management is reliable since it’s based on what we can predict. There are no shortcuts around physics in terms of conversion loss or forcing the sunshine to shine any harder. With this in mind, you can determine your charge time window and adjust your load before departing if the available time is less than what you need. As a result, planning turns uncertainty into a schedule.
This means you’ll know exactly how long it took to recharge by the time the low battery warning dims. You should of planned for the charge taper more carefully.