Route Elevation Profile Total Calculator
Total the climbing, descending, grade, energy load, and RV travel impact from a route elevation profile.
Include the start, every meaningful summit or valley, and the finish. The calculator totals every uphill and downhill segment separately.
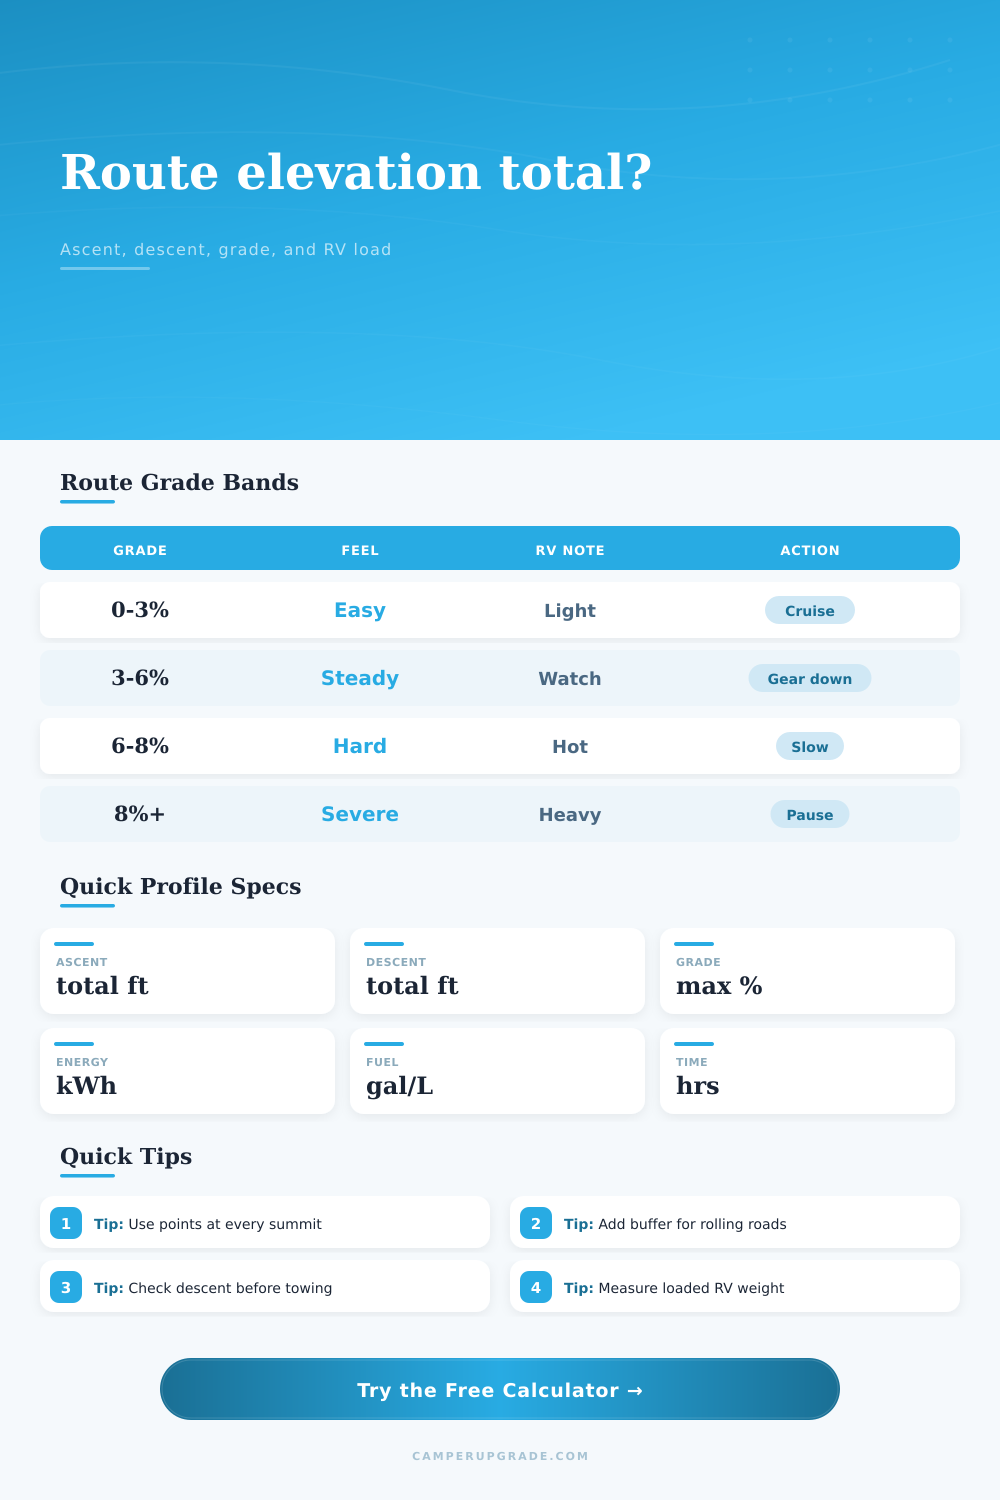
| Grade Band | Rise Per Mile | RV Driving Load | Profile Meaning |
|---|---|---|---|
| 0% to 3% | 0 to 158 ft | Light | Small fuel and time change |
| 3% to 6% | 158 to 317 ft | Moderate | Sustained downshifts are common |
| 6% to 8% | 317 to 422 ft | Heavy | Plan lower speeds and braking room |
| 8% to 10% | 422 to 528 ft | Severe | Route suitability depends on rig and weather |
| 10% plus | 528 ft plus | Extreme | Use only when the route is rated for your RV |
| Loaded Rig Weight | 1,000 ft Climb | At 24% Efficiency | Gasoline Equivalent |
|---|---|---|---|
| 8,000 lb | 3.01 kWh wheel work | 12.54 kWh fuel energy | 0.37 gal |
| 12,000 lb | 4.52 kWh wheel work | 18.82 kWh fuel energy | 0.56 gal |
| 16,000 lb | 6.03 kWh wheel work | 25.09 kWh fuel energy | 0.74 gal |
| 20,000 lb | 7.54 kWh wheel work | 31.36 kWh fuel energy | 0.93 gal |
| 24,000 lb | 9.04 kWh wheel work | 37.67 kWh fuel energy | 1.12 gal |
| Point Spacing | Best Use | Suggested Buffer | Why It Matters |
|---|---|---|---|
| Every 0.5 mile | Mountain switchbacks | 0% to 5% | Captures short dips and climbs |
| Every 1 mile | Typical pass profile | 5% to 10% | Good balance for ascent totals |
| Every 3 miles | Highway overview | 10% to 15% | May miss rolling terrain |
| Summits only | Fast planning check | 15% to 20% | Captures main climbs, not rollers |
| Start and finish only | Net elevation only | 20% plus | Cannot reveal hidden ascent |
| Route Type | Typical Distance | Total Ascent | Planning Note |
|---|---|---|---|
| Coastal campground hop | 25 to 60 mi | 200 to 1,000 ft | Fuel change is usually small |
| Foothill lake approach | 20 to 80 mi | 1,000 to 3,500 ft | Watch long steady pulls |
| Major western pass | 30 to 90 mi | 3,000 to 7,000 ft | Plan speed and cooling margin |
| Scenic ridge road | 40 to 120 mi | 4,000 to 10,000 ft | Descent time can dominate |
| National park climb | 10 to 45 mi | 2,000 to 6,000 ft | Confirm length and vehicle limits |
If you’re an RV owner, you’ll be familiar with elevation at top. There’s that signpost marking the pass. You see the number in your dash when you reach it, and then you store it away as information.
What most of us don’t realize until our engine is screaming for air is how many hundreds or thousands of feet we climbed up to that point. Thousands of feet of rolling ascent can mask itself behind what appears like a gentle route on a map, transforming a pleasant afternoon drive into heat management nightmare. Separating total accumulated grade from net elevation often make the difference between a smooth trip and a stranded rig.
Why You Need This Tool for Your RV Trip
So once you plug-in your route points, the calculator above does all this math for you. No more guesswork, did that dip in the road really cancel out that hill? Or do those tiny hills adds up? You input each significant change in terrain along the route. You must input more than just starting and ending elevations.
Most folks makes their mistake here. They look at the starting elevation and the ending elevation and think to themselves, “Hey, it’s only gained a couple thousand feet! It is a piece of cake! And they forget about sneaky uphill in the middle. Every time you go uphill, the tool tallies that section on its own. Climb half-a-thousand feet, drop down three-hundred, then rise again by another four-hundred: that’s twelve hundred feet of effort, not two. That make all the difference for your fuel tank and transmission.
The other variable that will break a route is weight. A loaded Class A motorhome won’t handle as well than a tow vehicle with an empty trailer. Because gravity doesn’t give a hoot about your horsepower rating, the inputs asks you how much your rig weighs. Mass converts kinetic energy into heat faster; longer grades mean heavier rigs has a harder time, especially if there are any steep segments as well.
At this point, you’re in a zone where engine braking is really the only control option. The tool’s reference tables breaks these grades into bands so it shows you when the load goes from light to severe. An eight percent grade feels like climbing a mountain goat trail, while a three percent feels like being on an on-ramp of a highway. If you know what band you’re playing in, then you’ll know if you need to start slowing down or downshifting.
The downside: Fuel economy suffers en route. It gets better descending, but not by as much to make up for the difference. The tool’s energy calculations takes into account drivetrain efficiency… I.e., how much actual power goes to moving the wheels vs. It accounts for how much fuel the engine burns. Gasoline engines aren’t very efficient at high resistance and low loads; going uphill fighting gravity directly is burning fuel. The tool calculates that cost in gallons and kilowatt hours, and also provides an estimate of your range so you get a realistic idea of what to expect. Most mountain roads has no gas stations, so knowing your range is important. You don’t want to run out of fuel anywhere near the summit.
But a lot of the time we don’t think about how we’ll get down. We’re too busy thinking about getting up. Using brakes again and again causes them to wear out. With this tool, you can choose a simulated level of engine braking during your decent. This helps plan a more realistic time of arrival than simply factoring in speed on a flat road.
If it’s a continuous grade, then you’ll go even slower descending than you did ascending. Plan to add some time for stopping. It never hurts to pull off and give the tranny a chance to cool. It’s not a lack of planning; it’s good driving.
Set the routes as presets, then use them to compare with what you think is doable. How does your calculated elevation compares to that of Beartooth or Monarch? Those are iconic passes you can reference. That lets you know if your route is mild or crazy.
You don’t want to complete the trip. You want to complete the trip without killing your brakes or frying the motor. Elevation isn’t some abstract number posted at the beginning of a road. It’s a measurement of work. Knowing how much work lies ahead before you pull into the parking lot helps keep things chill and your gear intact.
Would of loved to have seen this sooner.