River Flow Rate Calculator
Estimate river discharge in CFS and CMS from channel width, average depth, velocity, roughness, measurement method, segment count, and bankfull comparison.
River flow estimate
| Class | ft/s | m/s | Field meaning |
|---|---|---|---|
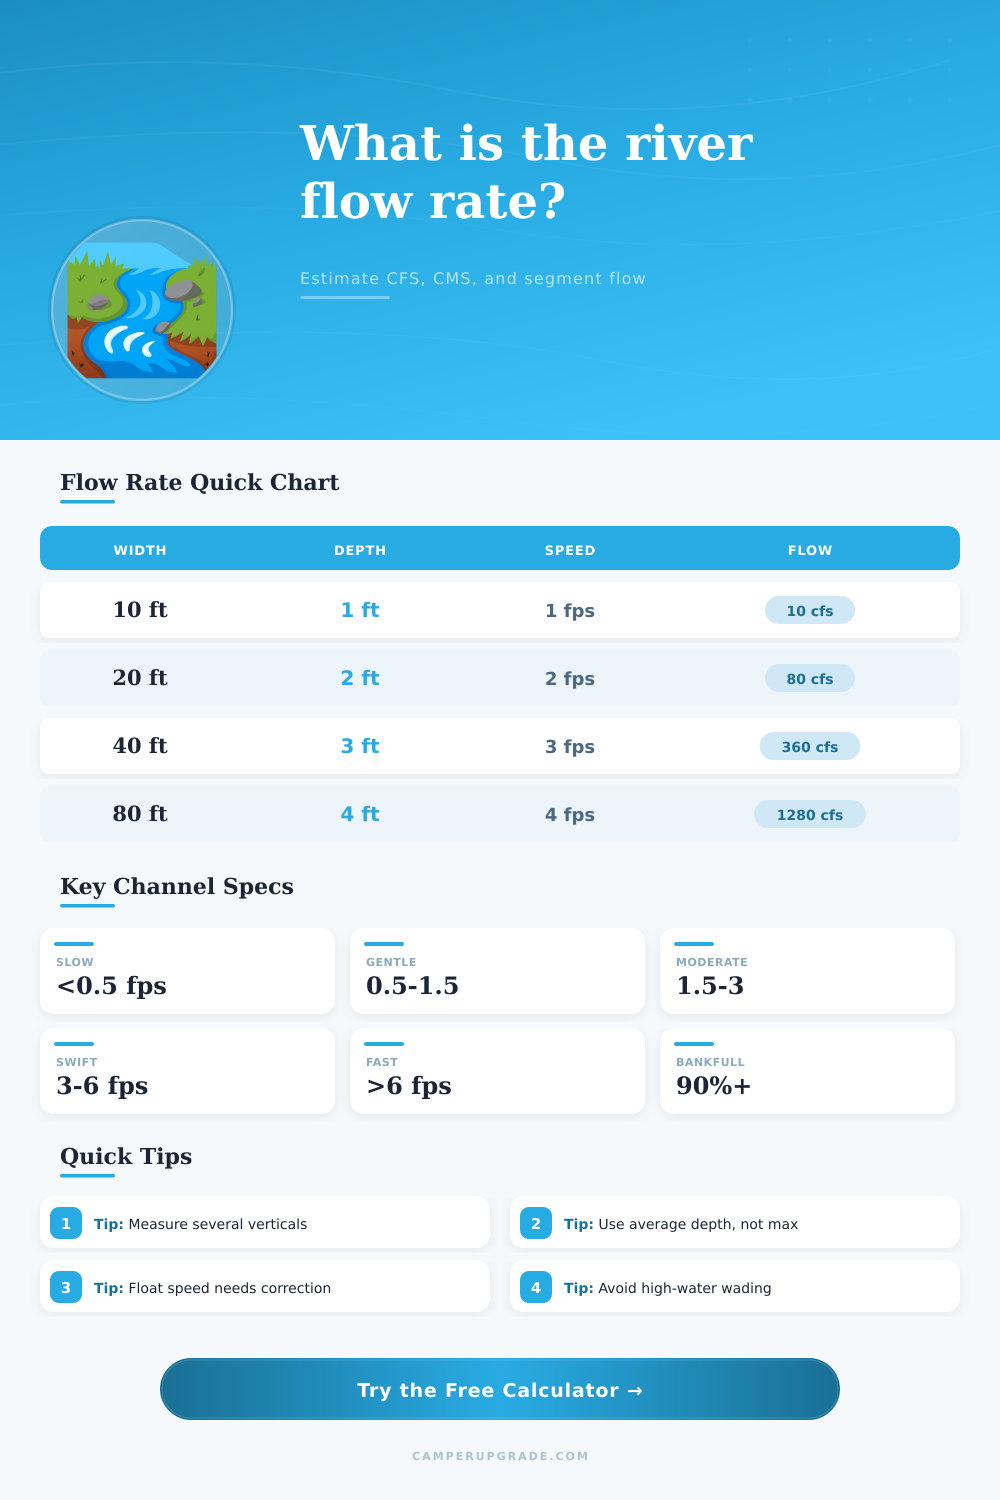
| Pool or very slow | Under 0.5 | Under 0.15 | Fine sediment and weak surface motion |
| Gentle glide | 0.5-1.5 | 0.15-0.46 | Easy float timing and stable shallow wading |
| Moderate run | 1.5-3.0 | 0.46-0.91 | Clear downstream pull with measurable current |
| Swift water | 3.0-6.0 | 0.91-1.83 | High force on legs, paddles, and probes |
| Fast or hazardous | Over 6.0 | Over 1.83 | Use remote or professional measurement methods |
| Method | Calculator factor | Best use | Notes |
|---|---|---|---|
| Current meter transect | 1.00 | Measured mean velocity | Use multiple verticals across the channel |
| Surface float timing | 0.85 | Simple field check | Surface speed is usually faster than mean velocity |
| ADCP or acoustic pass | 1.00 | Larger rivers | Keep correction near 1.00 unless QA suggests otherwise |
| Manning-style estimate | 0.92 | No direct velocity data | Roughness sensitivity matters more |
| Visual field estimate | 0.75 | Reconnaissance only | Use a wide confidence range |
| Dye or tracer timing | 0.90 | Small channels | Works best in a straight uniform reach |
| Channel condition | Manning n | Roughness signal | Typical reach |
|---|---|---|---|
| Smooth concrete or lined channel | 0.012-0.018 | Very low | Urban drainage channel |
| Clean straight natural stream | 0.025-0.035 | Low to moderate | Sand or gravel bed |
| Winding natural stream | 0.035-0.050 | Moderate | Pools, riffles, irregular banks |
| Brushy or boulder channel | 0.050-0.080 | High | Mountain creek or vegetated banks |
| Floodplain with heavy vegetation | 0.080-0.150 | Very high | Overbank flow paths |
| Current flow | Bankfull signal | Planning read | Field caution |
|---|---|---|---|
| Under 35% | Low channel | Normal baseflow or dry-season stage | Depths may be uneven |
| 35-65% | Moderate flow | Useful comparison to ordinary channel shape | Watch riffles and debris |
| 65-90% | High flow | Approaching active banks | Wading risk rises quickly |
| 90-110% | Near bankfull | Channel is close to spilling onto benches | Measure from bank or bridge |
| Over 110% | Overbank | Floodplain flow may be active | Avoid in-channel measurement |
Discharge are the measurement of the volume of water that pass a certain point within a specific period of time. Discharge is that measurement that determine whether or not a river crossing are safe, or whether fishes can navigate the river upstream. To calculate the volume of discharge for a river, three measurement of the river are required: the channel width, an average depth of the channel, and the velocity of the river.
The first of the three require measurements is the channel width. The width of the channel that should be measured is the wetted width of the channel rather than the width of the river from bank to bank. Within a braided river system, for instance, if a person measure the width from bank to bank, that value will be too large for use within the discharge calculation.
How to Measure River Discharge
The second of the three required measurements are the average depth. To calculate the average depth of the channel, a person should take a series of depth measurement across the entire width of the channel. If only a single depth measurement is taken in the middle of the channel, the measured value will be too deep.
If only a single depth measurement are taken near the bank of the channel, that value will be too shallow. The third of the three required measurements for calculating the volume of discharge of a river is the velocity of the river. The method that is used to measure the velocity will impact how the velocity is used within the calculation.
For instance, if a current meter is used to measure the velocity at sixty percent of the depth of the river, the velocity is likely to represent the mean velocity of the river. However, if a surface float is used to measure the velocity, the velocity will likely be too great because the surface of the water move faster than the water beneath it surface; in this case, a correction factor should be applied to the velocity to account for the difference between the two measurements. Finally, acoustic instruments that measure the velocity can determine the mean velocity of the river from surface to bed, and, therefore, do not require a correction factor to their measured velocity.
An additional factor that must be included in the calculation of the volume of discharge is the roughness of the river. Factors like river roughness will impact the velocity of the water within the river. For instance, a smooth concrete channel will exhibit less roughness than a gravel bed containing various branches of trees that has fallen into the river bed.
The value for roughness is represented as Manning’s n. Manning’s n can be determined by the type of river bed materials, and if that value is altered by even a small amount, the calculated value for the volume of river discharge will change by several percentage point. The calculator also provide a report of the flow rate of each segment of the river. The flow per segment report will indicate whether any segment of the river have a greater volume of discharge than other segment of that same river.
In rivers that are uniform in their characteristics, the volume of water that flows per segment will be similar throughout the river. In rivers that contain pools and riffles in their path, however, one or two segments may contain a disproportionate amount of the total river discharge. By noting the number of segments of the river, it is possible to divide the river into equal part; this division will reveal the different velocities of each segment.
Another piece of information provided by the calculator is the velocity class label of the river. The velocity class label will help to indicate various information about the velocity of the river. For instance, a gentle glide velocity will indicate that it is safe for human beings to wade in the river, but a velocity that is classified as swift water will indicate that the velocity of the water may push against an individual’s leg when moving through the water.
One last calculation that can be performed with the information that is obtained during the field work is the bankfull comparison of the river. The bankfull flow is the flow rate of the river when it is at its maximum flow; it is the depth of the water when the river begin to start to spill over its banks. The bankfull flow can be compared to the current flow of the river by entering a multiplier into the calculator that indicates the relationship between the two flows; the calculator will output the percentage of the bankfull flow that is being represented by the current flow.
If the percentage is near 100%, the river is approaching the point at which it will spill over its banks. If the percentage is significantly less than 100%, the river is within its normal range. Because the work that is performed during the fieldwork incudes taking measurements, uncertainty is inevitably introduce into that process.
For instance, it is impossible to ensure that the level of the water within the river remain the same during the period in which it is measured. Similarly, the wind may change during the time that a surface float is measured; the velocity of the float may change from what was measured. To account for this uncertainty in the measurements, it is important to average measurements from multiple river segments, and to note the time in which the measurements were taken.
The volume of discharge for a river can change according to the time of year that is being measured, and the weather during those period. The baseflow of rivers during the summer months may be much less than during spring months after snow melt on the mountains upstream of the river. Additionally, the passage of thunderstorms can lead to rapid increases in the discharge of a river.
It is important to consider both season and weather when considering the discharge of a river; the same amount of discharge can indicate different information to a fisheries biologist than a bridge engineer. Finally, the reference tables provided within the calculator are another means of determining the accuracy of the calculation of the rivers volume of discharge. These reference tables include information about the velocity class of the river, the characteristics of the water’s surface, the roughness of the river bed and its different characteristic, and the percentage of bankfull that the river is currently representing.
Each of these tables can be used to ensure that the information is accurate when it is provided to the calculator.