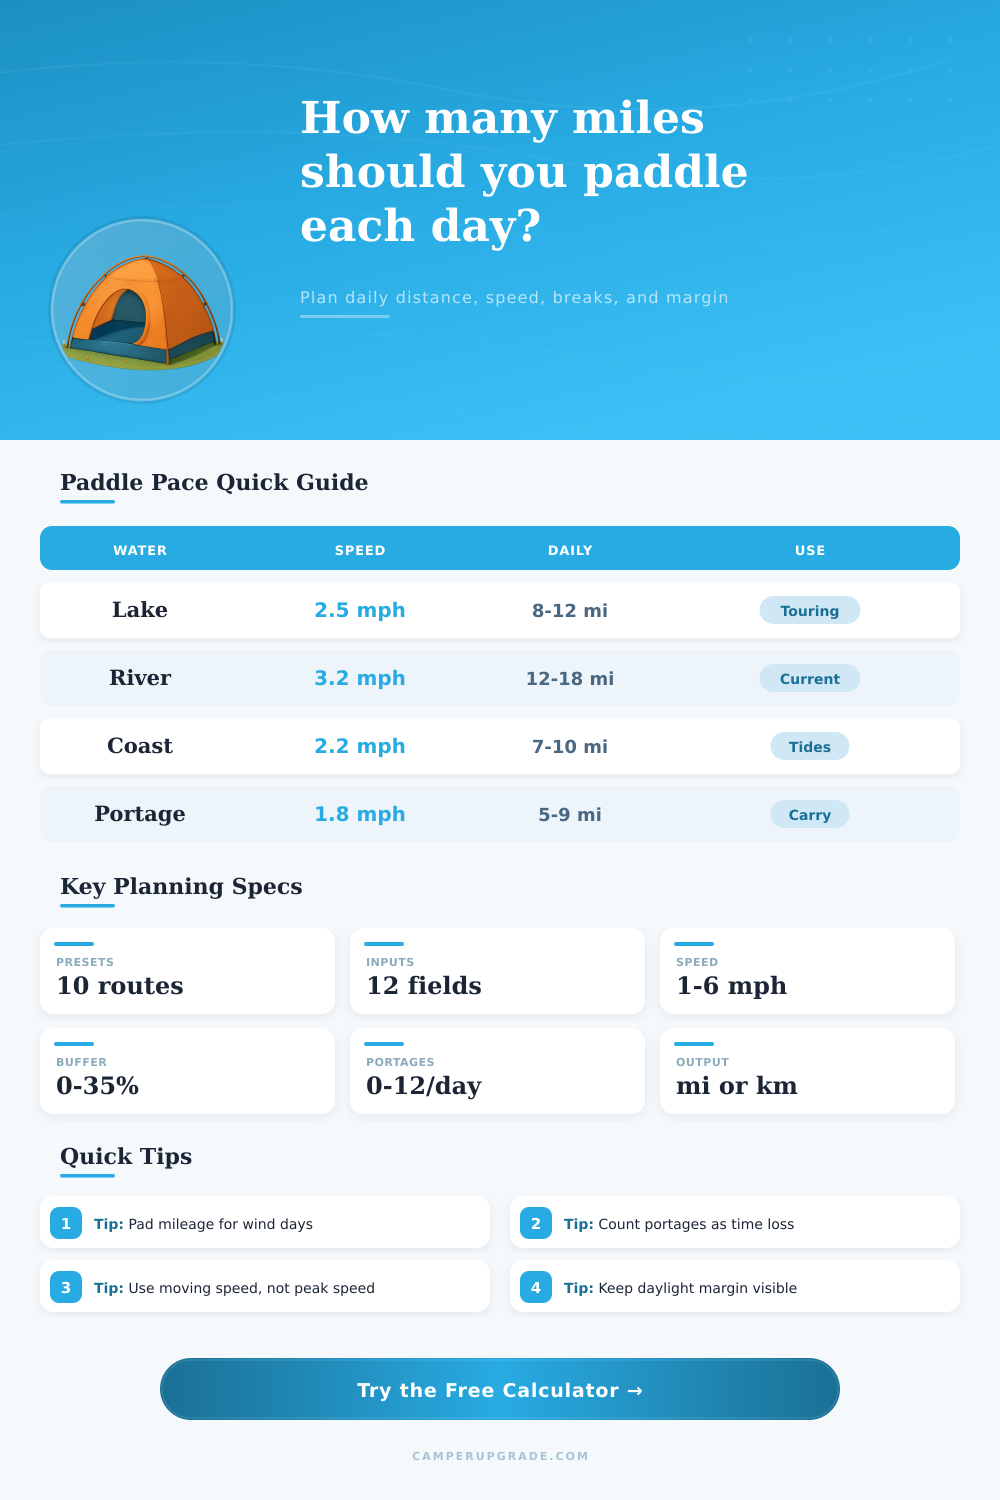
Paddle Trip Daily Mileage Calculator
Estimate daily paddling mileage, moving speed, water time, portage delays, break time, route buffer, and daylight margin for canoe, kayak, packraft, and touring routes.
🛶Paddle Trip Presets
⚙Route, Pace, Weather, and Time Inputs
📋Calculation Breakdown
⚙Paddle Plan Spec Grid
📘Reference Tables
| Paddling setup | Typical speed | Daily range | Planning note |
|---|---|---|---|
| Recreational canoe | 2.0-2.8 mph | 7-12 mi | Best with steady breaks and short crossings. |
| Touring kayak | 2.8-4.0 mph | 12-20 mi | Fast hulls still slow in chop or surf landings. |
| Loaded tandem canoe | 2.4-3.4 mph | 10-18 mi | Strong for river travel and gear-heavy routes. |
| Packraft | 1.4-2.4 mph | 5-10 mi | Allow more time for wind and ferry angles. |
| Condition | Modifier | Effect | Calculator choice |
|---|---|---|---|
| Calm sheltered water | 1.00x | Baseline pace | Calm or mixed wind |
| Light headwind | 0.92x | Small speed loss | Light headwind or chop |
| Moderate headwind | 0.80x | Harder crossings | Moderate headwind |
| Exposed strong wind | 0.68x | Shorten mileage | Exposed strong wind |
| Stop type | Time each | Daily loss | Use when |
|---|---|---|---|
| Quick shore stop | 10 min | 0.3-0.5 hr | Lunch and map checks only. |
| Short portage | 20 min | 0.7-1.3 hr | Carry trail is clean and known. |
| Long portage | 45 min | 1.5-3 hr | Gear shuttles or rough landings. |
| Tide or lock wait | 60 min | 1-2 hr | Schedule controls movement. |
| Route style | Buffer | Target day | Margin note |
|---|---|---|---|
| Marked lake loop | 5-10% | 8-12 mi | Use lower buffer in settled weather. |
| River with current | 10-15% | 12-20 mi | Check flow changes before launch. |
| Portage country | 15-25% | 5-10 mi | Time loss matters more than mileage. |
| Coastal route | 20-35% | 7-14 mi | Plan around tide and landing windows. |
💡Paddle Planning Tips
The main reason why most paddle trip fail is because they set an unreasonable mileage goal for each day. You draw a straight line between two campground and then divide that into the total number of miles. Great! That sets a goal. But it doesn’t account for friction. It doesn’t account for the time it takes you to unload your gear at a rocky landing (20 minutes). It doesn’t account for the debate over map when you lose your GPS signal. After three hours fighting a crosswind, your stroke efficiency go down.
The calculator above does the math for you when you plug in details about your route. Then you don’t have to guess at all those conversions and coefficients that tend to trip people up.
How to Plan Your Paddle Trip Safely
Where people gets confused about accuracy with planning is what’s called their moving speed vs. Average speed. Average speed take into account all stops, portage, and bathroom breaks. Moving speed is going speed when you have your hands in the water. Use your slowest boat after lunch as your entry point to the tool. Don’t put in your peak sprint speed from a calm morning. That’ll be your best-case scenario and if you plan accordingly, you’re probably not going to make it back by dark.
There is multipliers built into the tool for water type and wind exposure. These account for unseen drag that eats away at your speed. A moderate headwind may only reduce your speed by a few tenths of a mile per hour. But over the course of six hours of paddling, that mean missing out on miles of progress.
Trip planners also tend to overlook how much time portaging waste. You can also set how many times per day you will have to do a carry and how long each one will take. Don’t think because a carry trail isn’t very long that it won’t be quick. Try carrying 50 pounds of food up a rain drenched trail littered with tree roots. What looks like a generous 20 minute estimate per landing can take much longer. Remember you have to unload, regroup, check your gear and then get back in the boat to get going again. So if you have three portages, that’s an hour before you’ve even started down the next section. And you can’t make up time once the sun begin setting.
A reference table on this page shows exactly how much daylight different stop types will use up. An overwater journey has a harsh reality: managing your daylight. How much of your daylight do you use? That’s the question this calculator answers and the answer is what percentage of daylight do you want to spend doing non-essential things in the water. Anything beyond forty percent should of give you pause. You’ll want some wiggle room for missed marks while navigating, weather getting rough, or just plain tuckering out from paddling.
In mixed conditions, most people adds a 12, 15% buffer to their trip length because the route is not a straight line. Routes never follow a straight line. More often than not, wind will push you further off track. Having this margin allow you to stop somewhere safe when you get tired or the weather change.
So what does it tell you? What’s your daily margin different than how much time you want in the water? Do you see from the output that you’re going to be on the bank with just half an hour to spare before you want to land? Rethink things. Stress and poor decisions comes from tight schedules on the water. You want to have some cushion where you can take that extra-long lunch break or wander down a side inlet without checking the watch every few minutes. A good schedule isn’t about cramming as many miles as you can during the day. It’s about establishing a pace that keeps morale and energy levels high for multiple days of traveling.
To conclude. So, yes, there are times when I want to go faster. And there are days when I’d like to save some miles. But ultimately, it’s about getting to camp while you still have daylight and your shoulders can work. Before I even set out, the tool allows me to see the time, speed, and distance tradeoffs. It accounts for the actual lines of real world paddling instead of an ideal line on a map, and turns anxiety into confidence.
Knowing the exact level of effort required to get there. Knowing if we’ll make it before dark. Knowing when to stop. That clarity is worth more than any extra miles you might have squeezed in.