Pace From Grade Calculator
Estimate how climbs, descents, trail surface, pack weight, altitude, and route length change a flat hiking or running pace.
Grade Adjusted Pace
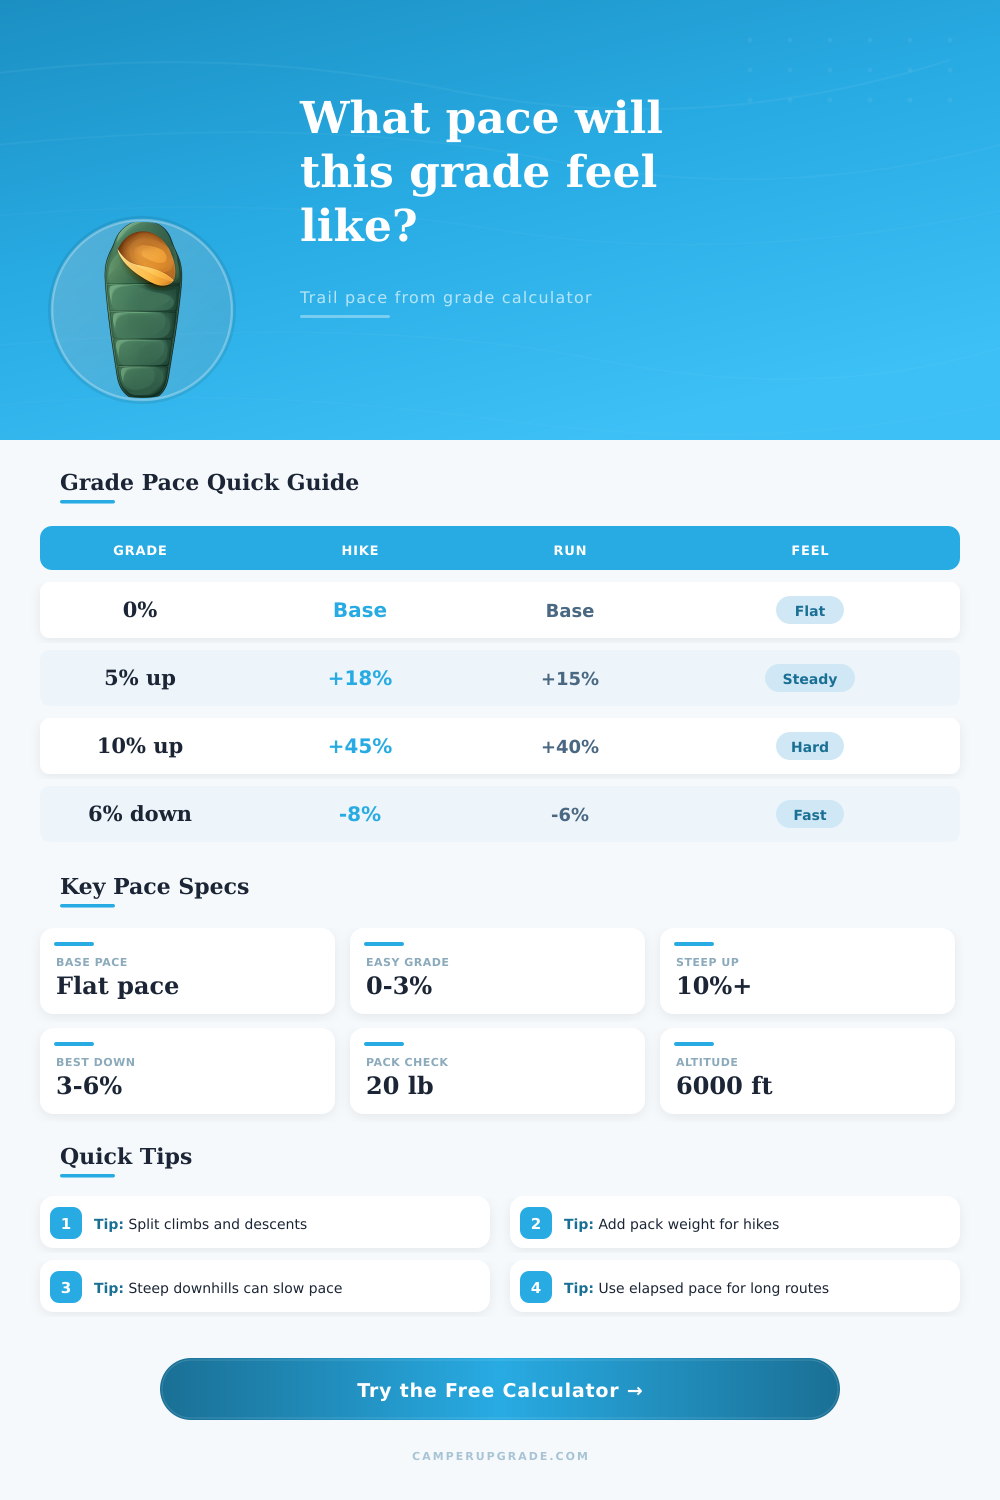
| Uphill grade | Hike pace effect | Run pace effect | Outdoor route note |
|---|---|---|---|
| 1% to 3% | About 4% to 11% slower | About 3% to 9% slower | Feels rolling if footing is clean. |
| 4% to 6% | About 15% to 25% slower | About 12% to 21% slower | Most hikers notice breathing change. |
| 7% to 10% | About 30% to 48% slower | About 27% to 40% slower | Power hiking often beats running. |
| 11% to 15% | About 55% to 85% slower | About 48% to 72% slower | Stride length and footing dominate. |
| 16% plus | Very route dependent | Usually hike effort | Use elapsed field notes when possible. |
| Downhill grade | Typical pace effect | Best use | Caution |
|---|---|---|---|
| 1% to 2% | Small speed gain | Roads and smooth paths | Benefit disappears on rough trail. |
| 3% to 6% | Fastest controlled band | Runnable or walkable descent | Watch braking on long drops. |
| 7% to 10% | Speed gain fades | Short descents | Quads and footing limit pace. |
| 11% to 15% | Often slower than flat | Technical hiking routes | Loose tread can erase downhill gain. |
| 16% plus | Very slow for many routes | Scrambles and steep trails | Use conservative elapsed pace. |
| Factor | Calculator range | Pace direction | How to apply it |
|---|---|---|---|
| Smooth road | 1.00x | No added slowdown | Best match for flat road pace inputs. |
| Singletrack | 1.08x | Moderate slowdown | Use for normal dirt trail with turns. |
| Rocky trail | 1.18x | Large slowdown | Good for roots, rocks, and step-downs. |
| Pack weight | Up to 1.32x | Slower with load | Backpacks affect hikers more than runners. |
| Altitude | Over 6000 ft | Slower at elevation | Adjusts gradually above the threshold. |
| Scenario | Grade mix | Base pace | Likely adjusted pace |
|---|---|---|---|
| Campground gravel loop | Low rolling grade | 20 min/mi hike | 21 to 23 min/mi |
| Wooded overlook hike | Long 8% climb | 24 min/mi hike | 34 to 42 min/mi |
| Road hill workout | 5% uphill repeat | 9 min/mi run | 10 to 11 min/mi |
| Loaded approach trail | 7% up, 6% down | 25 min/mi hike | 34 to 45 min/mi |
| Technical ridge traverse | Steep mixed grades | 30 min/mi hike | 50 min/mi plus |
If you want to plan out a day on the trail, here’s what to do first: How long will it take? Once you know how much elevation it gain, that’s when you start. First, use your flat pace. This is how fast you can hike on level ground with good footing and no pack.
Next, add in a rough guess at the hills, that’s where things often get hinky. You think this part is a gentle climb, so easy on paper. But then there’s the pack weight, the fatigue, and the loose rock that can stretch out a route by twenty or thirty percent. You think this part is a moderate descent; looks like fast travel. Unless it’s steep enough to require careful steps, then you’re slowed right down.
How to Calculate Your Hiking Time
How honesty do you count those grade effects? Often it’s the difference between finishing while there’s still daylight vs heading out into the night with a headlamp. That’s where the calculator on this page comes in: It replaces that guesswork with a few concrete inputs.
What’s your flat-moving pace? How far is it, total? What percentage of the route involve uphill, downhill, or flat section? How steep will both types of terrain be on average? What kind of surface will it be? How much weight are you carrying? What’s the elevation where most of the route occurs? All of these variables affect the cost of each mile and each one get its own input.
A rougher surface, like rocky singletrack, create more friction and a shorter stride. A heavier pack makes it harder to breathe and find balance with each ascent. At higher altitudes, there is less oxygen in the air and the recovery period after exertion are longer. The tool rolls them all up for you, so that the resulting pace take into account the entire route instead of just the number of miles on the map.
Splitting the section into its two natural halves. Ascent and descent, instead of calculating an average for the whole day is one helpful trick. Does it gain a gradual but continuous three miles before dropping the same distance? Or does it roll gently uphill for a half mile, then down again, over and over? The former’s a treat; go full bore up the incline and mind your feet coming back. The latter’ll have your ticker ticking between work and rest the whole day long.
Plug those different portions into the calculator and it report what each portion adds to overall time. Knowing the split makes it easier to determine if you need to get up sooner. It helps you see if you need to shed weight. It also helps you change your pace expectations about how far you can travel.
Think of your fatigue buffer as your real reserve, not an afterthought. You might not require additional time for a short test loop on home turf, but when a route pushes beyond known landmarks or extends well into the afternoon, a bit of cushion could of made all the difference. Unexpected snow patch, heat, or route-finding could tack on minutes that don’t show up in the grade math. With the buffer line, you’ll be able to add in that margin before you leave trailhead.
Immediately under the input boxes are reference tables that provide quick context on what to expect from various grades. These aren’t a substitute for your personal experience (and, in fact, looking at those patterns before you calculate helps you recognize when a route is about to cross from runnable to power-hike territory). But, they illustrate the general pattern, steep grades favor fast hikers over runners and vice versa; gentle grades favor smooth ground-running motion.
Ultimately, the best plans are the plans that align with how much effort you’re willing to put in on any particular day. This calculator provides a bit more clarity around the time it will take you, which lets you know if the route is compatible with your daylight and desired level of energy use.