Inverter Idle Draw Calculator
Estimate how much RV battery capacity an inverter uses while switched on, including sleep mode duty cycle, phantom AC loads, reserve limits, temperature derating, and solar offset.
⚡Named inverter standby presets
🔋Battery and inverter inputs
Formula breakdown
📊Inverter standby specification comparison
📘Reference tables
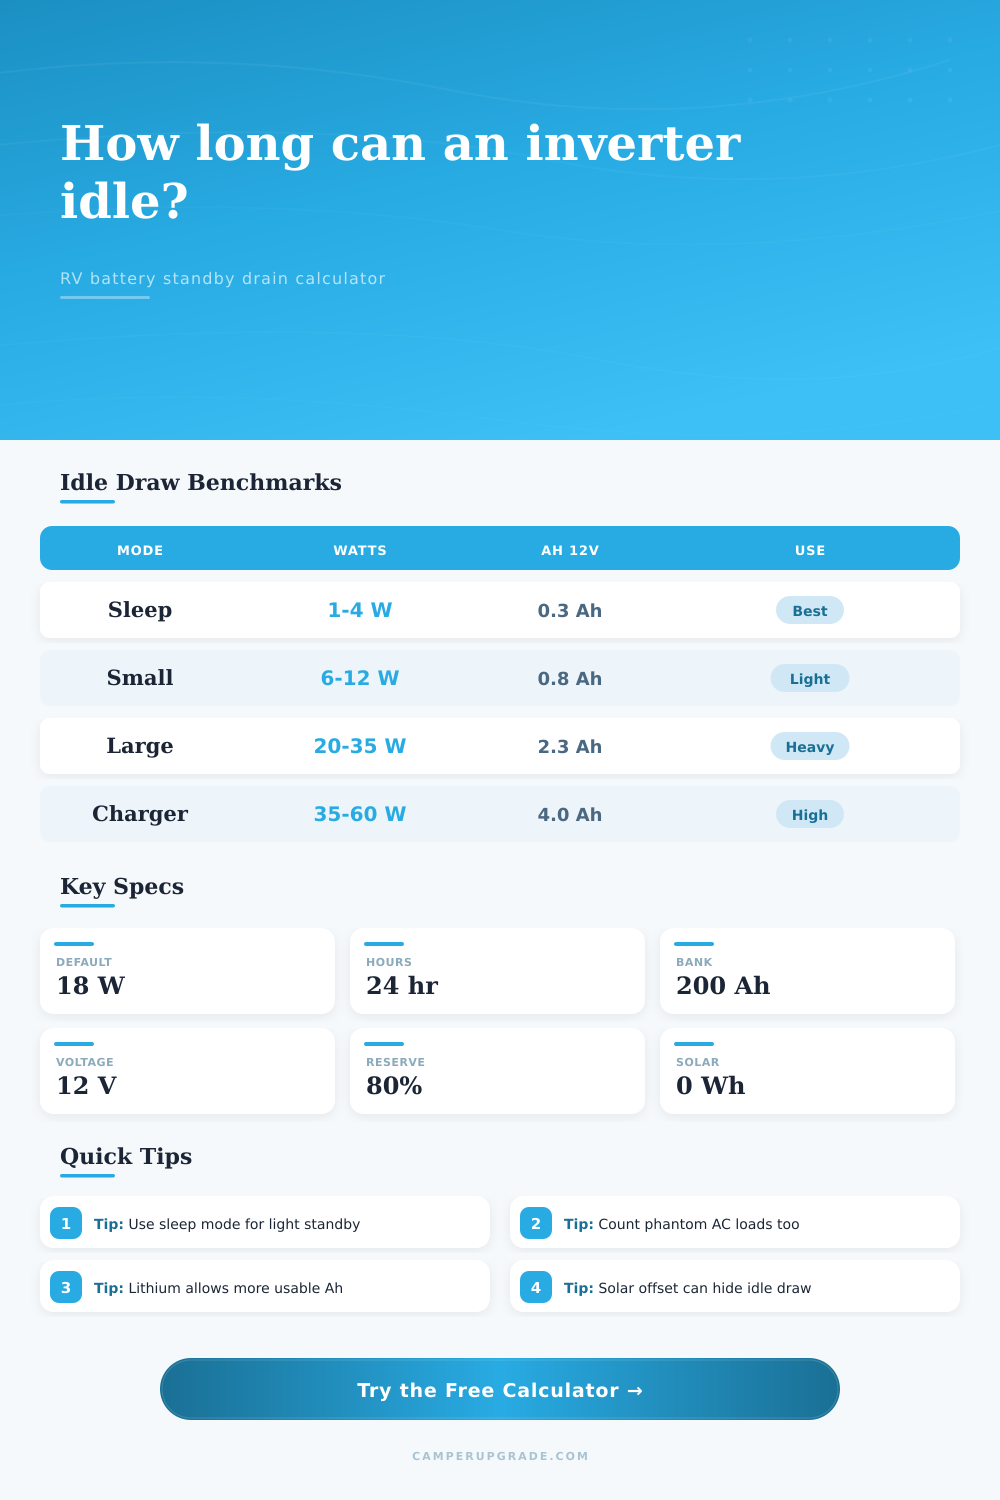
Idle draw by inverter class
| Inverter class | No-load draw | 12 V current | 24 hr energy |
|---|---|---|---|
| Search mode enabled | 1 to 4 W | 0.08 to 0.33 A | 24 to 96 Wh |
| 300 to 600 W pure sine | 5 to 9 W | 0.42 to 0.75 A | 120 to 216 Wh |
| 1000 to 1500 W pure sine | 8 to 18 W | 0.67 to 1.50 A | 192 to 432 Wh |
| 2000 W RV inverter | 15 to 30 W | 1.25 to 2.50 A | 360 to 720 Wh |
| 3000 W hybrid inverter | 25 to 45 W | 2.08 to 3.75 A | 600 to 1080 Wh |
| Inverter charger standby | 35 to 60 W | 2.92 to 5.00 A | 840 to 1440 Wh |
Daily drain examples at 12 V
| Idle watts | Hours on | Energy per day | Amp-hours per day |
|---|---|---|---|
| 6 W | 8 hr | 48 Wh | 4.0 Ah |
| 10 W | 24 hr | 240 Wh | 20.0 Ah |
| 18 W | 24 hr | 432 Wh | 36.0 Ah |
| 30 W | 24 hr | 720 Wh | 60.0 Ah |
| 45 W | 24 hr | 1080 Wh | 90.0 Ah |
| 60 W | 24 hr | 1440 Wh | 120.0 Ah |
Battery bank standby time before the usable limit
| Battery bank | Usable setting | Usable Wh | Days at 18 W idle |
|---|---|---|---|
| 12 V 100 Ah LiFePO4 | 80% | 960 Wh | 2.2 days |
| 12 V 200 Ah LiFePO4 | 80% | 1920 Wh | 4.4 days |
| 12 V 400 Ah LiFePO4 | 80% | 3840 Wh | 8.9 days |
| 12 V 200 Ah AGM | 50% | 1200 Wh | 2.8 days |
| 24 V 200 Ah LiFePO4 | 80% | 3840 Wh | 8.9 days |
| 48 V 100 Ah LiFePO4 | 80% | 3840 Wh | 8.9 days |
Common RV phantom loads through an inverter
| Connected item | Typical standby watts | 24 hr DC Wh at 88% | 12 V Ah per day |
|---|---|---|---|
| Microwave clock and control board | 2 to 4 W | 55 to 109 Wh | 4.5 to 9.1 Ah |
| Television standby | 1 to 3 W | 27 to 82 Wh | 2.3 to 6.8 Ah |
| Router or hotspot power brick | 4 to 8 W | 109 to 218 Wh | 9.1 to 18.2 Ah |
| Laptop charger left connected | 2 to 6 W | 55 to 164 Wh | 4.5 to 13.6 Ah |
| Residential fridge electronics | 5 to 12 W | 136 to 327 Wh | 11.4 to 27.3 Ah |
| Smart speaker or display | 2 to 5 W | 55 to 136 Wh | 4.5 to 11.4 Ah |
💡Calculation tips
Even if nothing is plugged into it, an inverter will continue to suck down juice from your battery. So here’s how that works: You pull over for the weekend thinking everything is quiet. But the thing doesn’t shut off; it’s still running inside that wall panel. It’s burning up your stored juice so that you can plug something in later, That silent drain can be disastrous by Tuesday morning.
To better grasp the math, check out this handy calculator. But you should of know why it’s draining too. Many folks think that an inverter draw no current unless something is plugged into it. Wrong! There’s also power used just by the inverter for its own operation. Standby indicators, cooling fans, and internal circuits all draws juice. Some small pure sine inverters will pull maybe a couple of watts per hour. Sounds like nothing right? Multiply that by twenty-four hours and then by three days of parked camping, and it starts to add up. A big 2000-watt unit might idle at 15 watts or more. That’s what makes the difference between keeping your batteries topped up or needing heavy-duty chargers to catch up.
How Inverters Drain Your Battery Even When Not Used
The tool will ask you what kind of inverter you have and what its no-load draw is (a number you should measure with a clamp meter rather than trusting the broad ranges often listed in manuals). Don’t assume the manual’s range applies; it won’t. That tool then takes that number and factors in the number of amps used by any phantom load devices like microwaves, router bricks, laptop chargers, etc., which draw electricity 24/7 despite being turned off. Add those up, and they add up fast. Then the tool translates that AC watts to DC amp hours, including accounting for losses in converting AC to DC.
This is important because lithium banks take to partial discharge like a champ, whereas lead acid batteries do not. Knowing your battery type adjusts your reserve requirements because lithium banks handles partial discharges with ease while lead-acid batteries does not. But there’s more: You should plan around temperature. Older AGM and flooded batteries is rated lower in cold temperatures. When you think they’re holding as much juice as ever, that’s not true. That’s why these batteries have lower ratings; the inputs give you an estimate based off real-world use instead of perfect test-lab results.
Running solar panels while parked offsets some of daytime loss. Basically, you hide the idle draw from your battery meter. It sounds minor, but it’s something to consider when packing RV. As you can see from the reference table, there are some typical benchmarks to give you an idea of where your set up lands. Generally speaking, your RV fridge will pull significant standby power via its electronics. The standby draw alone is much more than just the compressor cycling on and off. Add that to leaving a high-idle inverter charger running accidentally and you’ve burned half a day’s worth of battery life while parked.
Don’t underestimate idle draw. It is the starting price of being able to have the juice. Not taking it into account is like flying blind once your batteries doesn’t behave as expected. Plug in the number and know what your sweet spot is. Will it be worth powering all day long by solar or a generator so you can keep the engine off? Once you know exactly what your silence is costing you, you’ll make sure the next outing leaves you energized. And that knowledge will allow you to turn a potential frustration into something you can handle. You’ll be able to park longer and stop worrying about those battery gauge numbers staring back at you from the dash.