Hiking Elevation Gain Per Hour Calculator
Estimate vertical pace, elapsed climb rate, grade, target time, and trail-adjusted effort from your hike data.
This calculator compares climbing rate from your own inputs. Terrain, weather, footing, acclimatization, and group management can change real hiking speed.
Vertical pace estimate
The rows below update after each calculation and show how much elevation this pace covers in common climbing blocks.
| Block | Gain at moving rate | Gain at elapsed rate | Distance at climb grade | Use |
|---|---|---|---|---|
| Calculate to build split targets. | ||||
| Band | ft per hour | m per hour | Typical context |
|---|---|---|---|
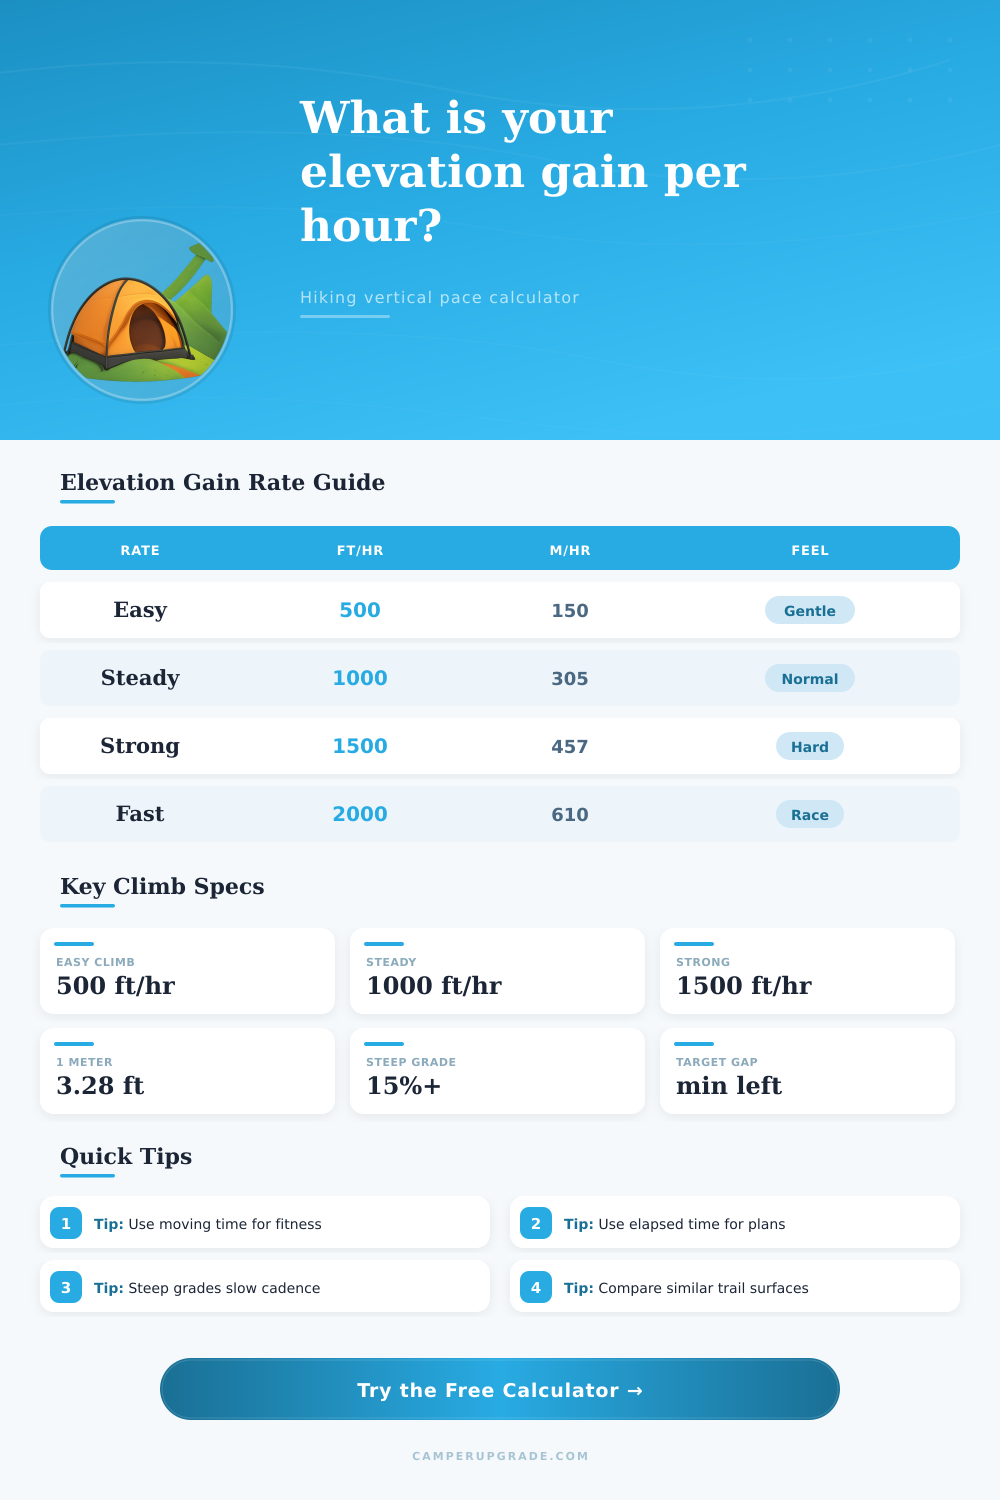
| Recovery or casual | 300-700 | 90-215 | Easy group hike, heavy photo stops, rough footing |
| Steady recreational | 700-1200 | 215-365 | Most day hikers on a maintained climbing trail |
| Strong mountain pace | 1200-1800 | 365-550 | Fit hiker, light pack, sustained aerobic push |
| Very fast ascent | 1800-2400 | 550-730 | Trail run, race pace, or short hard climb |
| Elite or short effort | 2400+ | 730+ | Steep time trial, vertical race, or brief repeat |
| Average climb grade | Gain per mile | Gain per km | How it usually feels |
|---|---|---|---|
| 3-6% | 160-320 ft/mi | 30-60 m/km | Runnable or fast hiking for many people |
| 6-10% | 320-530 ft/mi | 60-100 m/km | Classic steady trail climb |
| 10-15% | 530-790 ft/mi | 100-150 m/km | Strong uphill hiking, shorter stride |
| 15-25% | 790-1320 ft/mi | 150-250 m/km | Steep switchbacks, stairs, or direct fall-line trail |
| 25%+ | 1320+ ft/mi | 250+ m/km | Very steep trail, scramble, snow, or loose slope |
| Vertical rate | Metric rate | 15 min gain | 30 min gain |
|---|---|---|---|
| 500 ft/hr | 152 m/hr | 125 ft / 38 m | 250 ft / 76 m |
| 1000 ft/hr | 305 m/hr | 250 ft / 76 m | 500 ft / 152 m |
| 1500 ft/hr | 457 m/hr | 375 ft / 114 m | 750 ft / 229 m |
| 2000 ft/hr | 610 m/hr | 500 ft / 152 m | 1000 ft / 305 m |
There’s one big question when planning any hike: Can I make it there in time? The answer is how much elevation you gain per hour. Most hikers has a general feeling for how fast they ascend vertically, but this calculator turns that vague feeling into a concrete figure you can plan around. This page will do just that.
The inputs alter the output. Total gain is how far up your legs need to move. Uphill % and distance help calculate how steep the true climbing portions of the hike will be. Stopped time and moving time shows the difference between logistics and fitness; even if you climb well, taking a break slows down your climbing rate. Altitude & pack weight change results based off real-world effort. You’ll go slower on a full pack, and higher elevation also slow you down, but neither effect is accounted for in raw numbers. Climb patterns and terrain mean that a series of roller coasters use more energy than an equivalent distance of smooth switchback climbs.
How to Use the Hiking Calculator
After plugging those numbers into the sheet, it spits out two sets of vertical rates: the moving rate (what you’ll produce going uphill), and the elapsed rate (how fast you can commit to a ride or partner at the trail head). Grade calculates how steep/steady the climb is, does your gait need to be shortened? Target comparison looks at your pace and lets you know whether you’ll make it over the top on time or end up being left behind. Normalized rate subtracts penalty for altitude and surface, allowing you to compare this ascent to others made on easier terrain.
That’s why I find this comparison helpful; not only does fitness affect vertical, but so does altitude and the type of terrain. High altitude, loose rock, and whether a trail is maintained or not can all make a difference in the feel of a 1200 feet per hour day. Unmaintained) can all make a difference in the feel of a 1200 feet per hour day.
While your choice of factors allows you to account for some of that in the calculator, things like weather, sleep quality, and waiting for slower hikers will extend the day beyond what the calculator could predict. That is still up to you.
To put results in perspective, without having to remember what each benchmark means, there are some helpful reference tables on the page. These compare the felt effort of different surfaces with their grade equivalent. They also show how fast a rate feels on the ground. Does my intended pace seem reasonable for the surface I’ll be traveling on?
But it’s when you repeat the same route with different assumptions that the true use emerges. Try adjusting the terrain factor, or change pack weight and see how the target gap expands or contracts. This little exercise hones your ability to spot trade-offs that matter on the trail. You begin to pick up on those routes that look moderate on paper but is going to require a slower vertical pace when the terrain gets rougher or the elevation rises.
The calculator begins to become less of a one-off calculation and more of a simple talk you have with each new plan as you walk out of car.
You should of used this earlier.