Glamping Nightly Rate Break Even Calculator
Estimate the nightly glamping rate needed to recover land improvements, platform or tent investment, furnishings, operating cost per night, cleaning, occupancy, seasonal nights, and target payback months.
⛺Glamping Presets
📋Build, Cost, And Season Inputs
Calculation Breakdown
📌Quick Benchmark Cards
🧭Rate Scenario Comparison Grid
Base Case
$0Calculated from the current inputs.
Lean Occupancy
$0Lower occupied nights require a higher rate.
Stronger Season
$0Higher occupancy spreads fixed payback.
Longer Payback
$0More months reduce the required nightly rate.
📊Glamping Break Even Reference Tables
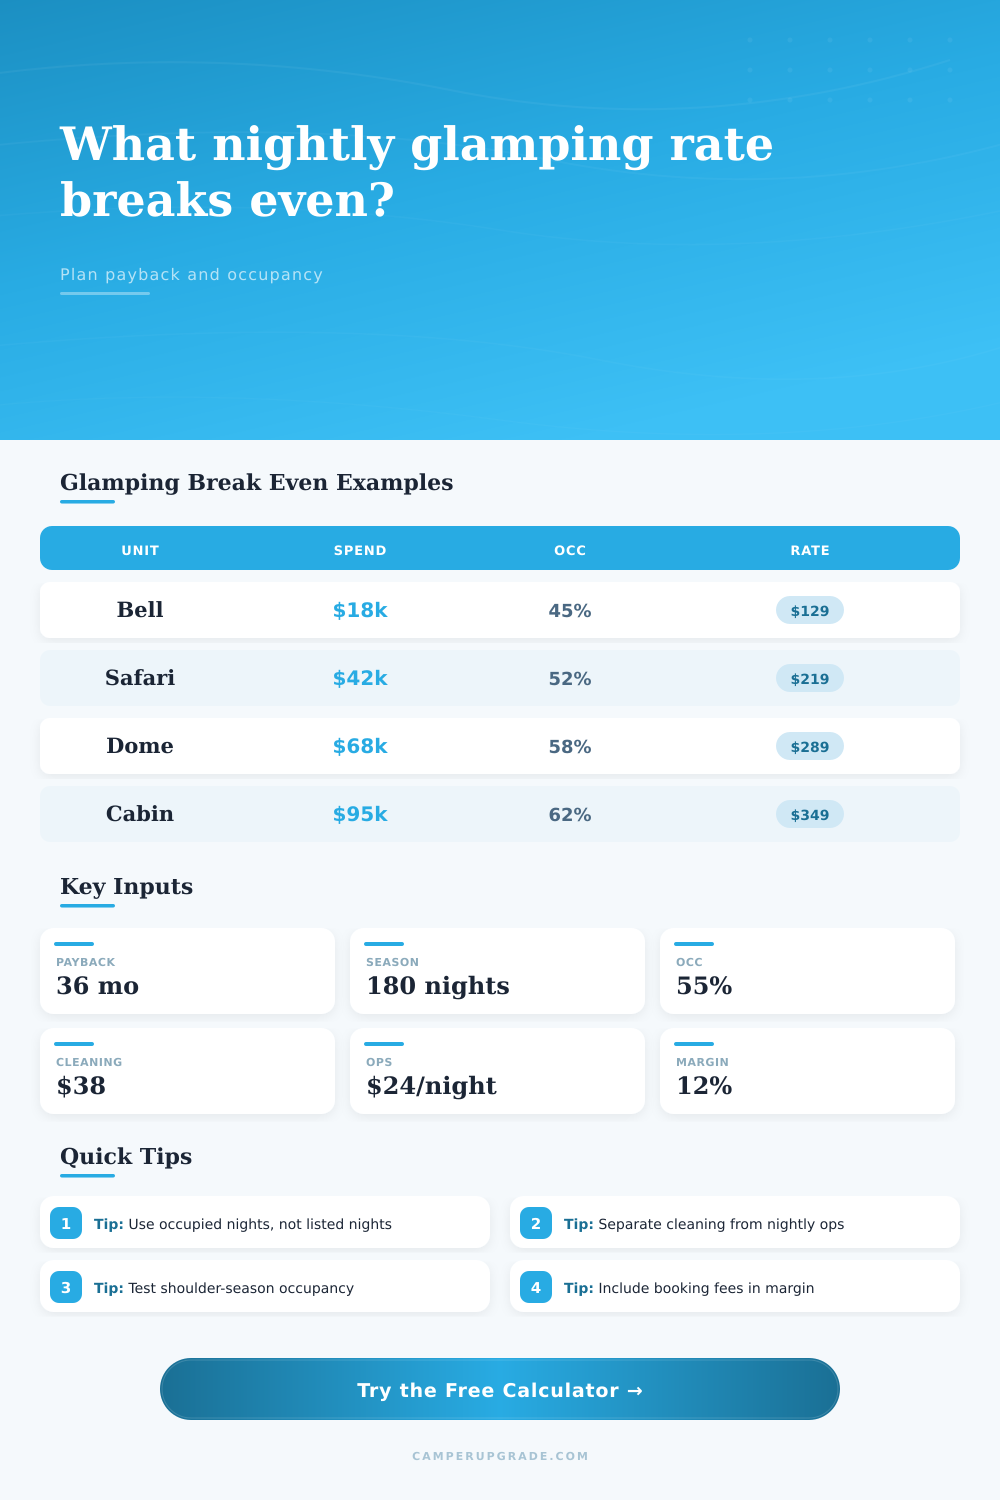
| Unit Style | Typical Fixed Spend | Common Occupancy | Planning Signal |
|---|---|---|---|
| Bell tent starter | $15,000 to $28,000 | 35% to 50% | Low build cost, but weather and season length matter. |
| Deck canvas suite | $28,000 to $48,000 | 42% to 58% | Platform and furnishings create a mid-rate target. |
| Safari tent with bath | $45,000 to $85,000 | 48% to 65% | Private bath raises spend and supports stronger rates. |
| Dome or yurt | $55,000 to $95,000 | 50% to 68% | Higher shell cost needs photos, views, and longer season. |
| Tiny cabin | $80,000 to $140,000 | 55% to 72% | More durable unit can justify year-round modeling. |
| Seasonal Nights | Occupancy | Occupied Nights | Use Case |
|---|---|---|---|
| 120 nights | 45% | 54 nights | Short summer operation with limited shoulder demand. |
| 180 nights | 55% | 99 nights | Common warm-season glamping forecast. |
| 240 nights | 60% | 144 nights | Extended destination season or mild climate. |
| 300 nights | 62% | 186 nights | Near year-round site with cold-weather readiness. |
| Expense Input | Where It Belongs | Rate Effect | Common Mistake |
|---|---|---|---|
| Build cost | Fixed investment | Spread across payback months | Leaving out utilities, pad, or deck site work. |
| Tent or shell | Fixed investment | Raises payback per occupied night | Mixing replacement reserve into nightly ops twice. |
| Operating cost | Per occupied night | Adds directly to every occupied night | Using listed nights instead of occupied nights. |
| Cleaning | Per stay | Spread by average stay length | Forgetting short stays create more turns. |
| Booking fee | Revenue deduction | Grosses up required nightly rate | Applying commission after judging break-even. |
| Payback Target | Annual Seasons | Pressure On Rate | Best Fit |
|---|---|---|---|
| 18 months | 1.5 seasons | Very high | Fast test, premium view, or low build cost. |
| 24 months | 2 seasons | High | Small unit with clear demand and strong weekends. |
| 36 months | 3 seasons | Moderate | Balanced planning target for many operators. |
| 60 months | 5 seasons | Lower | Durable shell, longer season, or portfolio unit. |
📘Formula Notes
Total investment = build cost + platform, tent, or shell cost + furnishing cost + other upfront reserve.Occupied nights per season = seasonal nights listed x expected occupancy percent.Break-even nightly rate = (payback per occupied night + operating cost per occupied night + cleaning cost per night) / retained revenue percent.
💡Glamping Rate Tips
While beauty may be in the eye of the beholder, there’s no mistaking the numbers when calculating economics of glamping. You need to find the point at which your nightly rate break even on the costs of permits, the deck, and the canvas. That’s why a glamping nightly rate break-even calculator is such a great planning tool.
The main mistake most operator make is to focus solely on nightly rate. They’ll see what the guy next door charge and charge that amount too. That is not enough because a single rate does not account for your actual occupancy or your specific fixed cost.
How to Use a Glamping Break-Even Calculator
Our calculator separates those variables: your upfront build investment and your ongoing operating expenses. It makes a difference, since a hard-sided cabin has a different payback strategy than a bell tent, for instance. Then think about the inputs that went into building the property (permits), utilities, site work. Those aren’t always counted for, but you spent eighteen grand getting it in shape and you want to recoup that investment in the time frame you’re targeting.
The tool spreads all those fixed costs over the number of nights you expect to be occupied. Fewer nights per year mean each night carries more weight. Less-than-projected occupancy rate mean the necessary nightly rate gets much higher. People make mistakes here by thinking fifty percent occupancy is a safe bet without verifying whether there’s demand locally to support it.
The last variable is the per-guest cost for utilities, laundry, and cleaning fees. These aren’t annual costs, they’re a drain on your income each time someone rent your space. The calculator factors in average length of stay, and this is another key factor: If you get shorter stays, then your “effective” cost per night increase because there will be more cleaning turns during the season. A one-night stay result in the same cleaning bill as a two-night stay, but it spreads that cost across fewer revenue days, and the math takes that into account automatically.
To do this, you’ll want to try out various assumptions, for example, perhaps in your second year you’ll be able to reach sixty percent occupancy. With the tool, you can model what that best case scenario look like. And if it’s a lean season, maybe you’re only going to reach thirty-five percent occupancy. The tool allows you to model that worst-case scenario as well, and the gap between those two determines whether you break even or lose money. This will force you to get real with yourself about local demand and your marketing capability.
On the page, it’s laid out in that way, using a comparison of types of unit (see the table on the page). If your starting point is something like a simple tent, the breakeven may be at a lower percentage but the maximum price you can charge is lower too. On the other end, say you’re doing a premium safari tent with a private bathroom, that will cost more to construct, so its break-even rate are higher. But you can also charge a higher top-end rate for those prime weekend nights. The tradeoff is that you take on more initial risk but have greater potential for long-term revenue. The calculator helps identify the point where that tradeoff makes sense for you.
Remember: Those booking fees also cost money. Payment processors will charge a percentage of each transaction, and platforms will take their cut as well. That eats into your gross revenue before you recieve a dime. Enter the margin buffer. If not, you could think that you’re at break-even when, in fact, you’re hemorrhaging two dollars per night in hidden fees. It is a small thing, but it matters.
After all, determining your glamping rate isn’t some kind of arts and crafts activity. Your balance sheet determines it. You book with the visuals, but you pay the bills based off the numbers.
Take advantage of the tool so that you understand what your floor price is, the lowest rate at which you could survives. You can market accordingly in order to hit that figure. With numbers in hand, you can bring the romance of the sunset back into focus.