Elevation Gain Per Mile Calculator
Estimate climb density, grade equivalent, route effort band, and descent-adjusted hiking load from total gain, distance, descent, highest elevation, pack weight, trail variability, and switchbacks.
🗺Hiking Route Presets
⚙Elevation Inputs
⚡Elevation Spec Grid
The main gain-per-mile result stays raw and easy to audit. The effort band uses a planning score that adds descent load, pack load, highest elevation, grade variability, and switchback context.
📊Climb Density Reference Tables
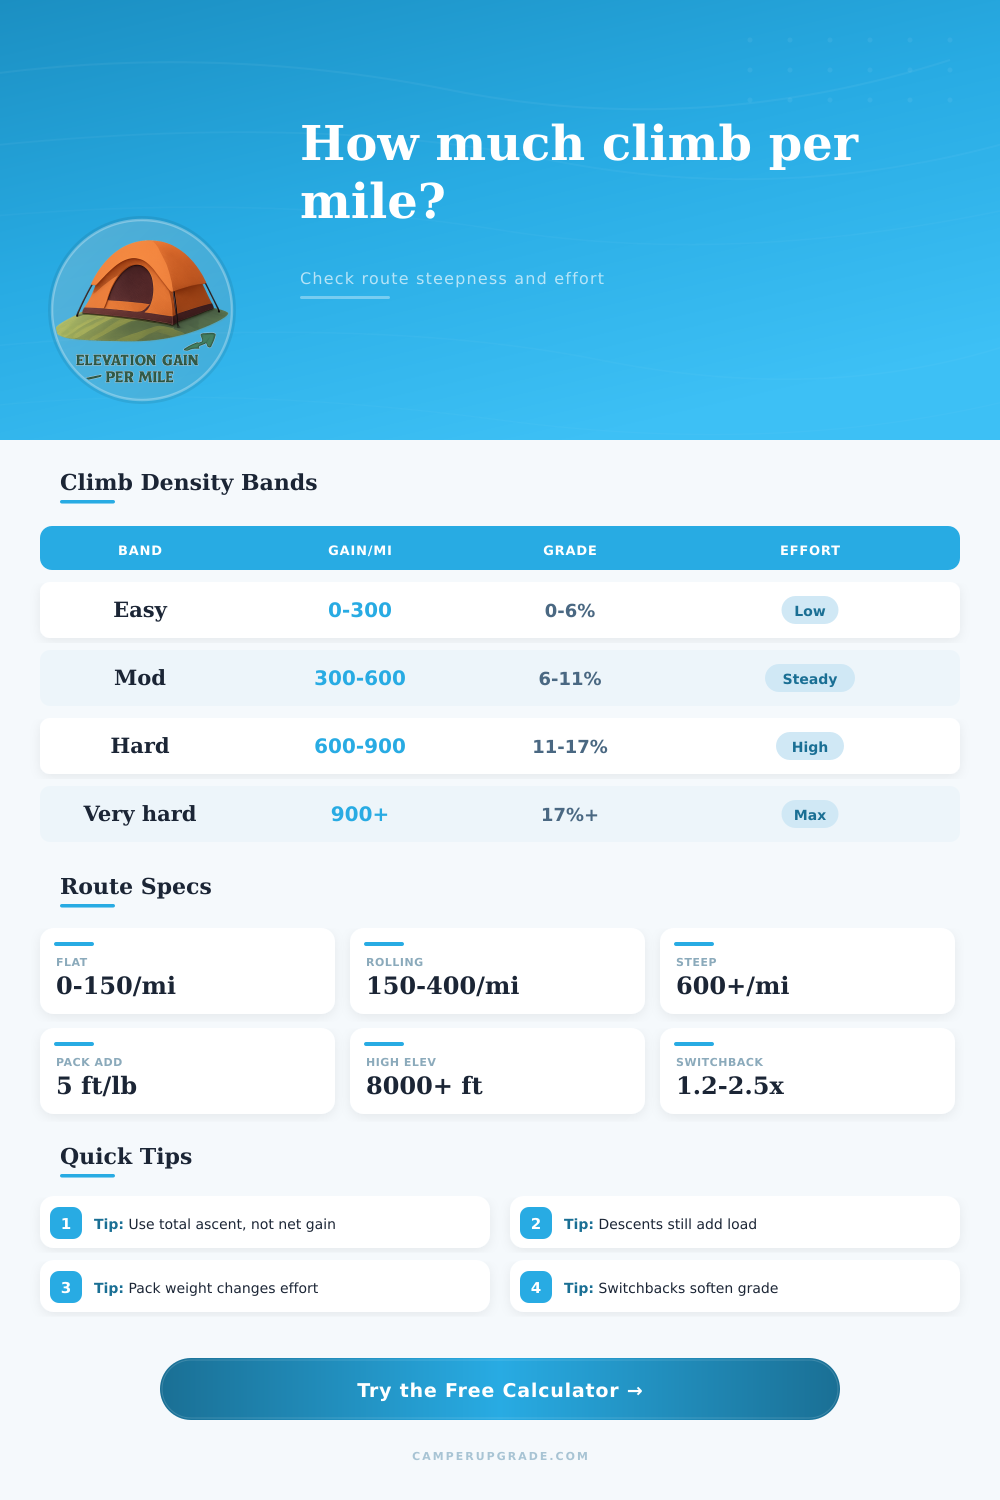
| Gain per mile | Metric equivalent | Grade equivalent | Typical hiking feel |
|---|---|---|---|
| 0-150 ft/mi | 0-28 m/km | 0-2.8% | Mostly flat walking with small rises, common along rivers, lakes, and rail trails. |
| 150-300 ft/mi | 28-57 m/km | 2.8-5.7% | Rolling trail where climbs register but rarely dominate the day. |
| 300-600 ft/mi | 57-114 m/km | 5.7-11.4% | Moderate to hard hiking, especially with a full daypack or warm conditions. |
| 600-900 ft/mi | 114-170 m/km | 11.4-17.0% | Steep mountain trail, often slower than map distance alone suggests. |
| 900-1200 ft/mi | 170-227 m/km | 17.0-22.7% | Very steep sustained climb, common on direct summit routes and old trail grades. |
| 1200+ ft/mi | 227+ m/km | 22.7%+ | Extremely steep travel where footing, steps, exposure, and breaks matter. |
| Route style | Common distance | Common gain per mile | Planning note |
|---|---|---|---|
| Nature loop or campground trail | 1-4 miles | 0-250 ft/mi | Short distance and low climb density usually make pace more important than ascent. |
| Rolling forest day hike | 4-9 miles | 200-500 ft/mi | Repeated small climbs can feel harder than a single smooth grade. |
| Canyon or valley route | 5-12 miles | 250-700 ft/mi | Check descent because the hardest climbing may come on the return. |
| Mountain pass or summit | 6-14 miles | 600-1100 ft/mi | Expect slower climbing pace, more snack stops, and bigger weather swings. |
| Backpacking segment | 8-18 miles | 250-800 ft/mi | Pack weight and accumulated descent can move the route up one effort band. |
| High alpine traverse | 6-16 miles | 400-900 ft/mi | Highest elevation and uneven grade can matter as much as raw ascent. |
| Switchback factor | Route shape | Grade effect | How to interpret it |
|---|---|---|---|
| 1.00x | Direct line | No softening | Useful for stairs, direct fire roads, and straight fall-line trails. |
| 1.15x | Mild bends | Slightly lower route grade | Common on short rolling sections where the path bends around terrain. |
| 1.35x | Moderate switchbacks | About one-quarter gentler than direct | A good default for many maintained climbing trails. |
| 1.60x | Frequent switchbacks | Much gentler route grade | Distance rises, but the grade usually feels more sustainable. |
| 2.00x | Long contouring route | About half the direct grade | Often used where erosion control or pack-friendly walking matters. |
| 2.50x | Very gentle traverse | Low walking grade | May add time even though each step feels less steep. |
| Input | What it changes | Calculator treatment | Best source |
|---|---|---|---|
| Total gain | Raw climb density | Divided by route distance for gain per mile | Map profile, GPS track, or guidebook ascent |
| Total descent | Braking load and fatigue | 25% of descent is added to adjusted density | Route profile or out-and-back estimate |
| Pack weight | Load on climbs and descents | 5 ft per mile equivalent per pound carried | Scale weight at trailhead |
| Highest elevation | Altitude effort allowance | Adds after 8,000 ft, capped for planning | Topo map, trail description, or GPS app |
| Grade variability | How gain is distributed | Multiplies the climb and descent components | Profile shape and trail memory |
| Switchback factor | Grade comparison | Shows route grade versus direct-grade equivalent | Trail map shape or route design estimate |
💡Elevation Planning Tips
Raw gain per mile is the clean comparison between routes. Adjusted climb density is better for deciding food, water, pace, and how hard the route may feel.
A route can have moderate gain per mile but still feel punishing when the descent is long, loose, or stair-stepped. Add descent and variability instead of judging only the climb.
This calculator is a planning estimate. Weather, snow, heat, altitude acclimatization, trail surface, navigation errors, fitness, and group pace can all change real route difficulty.
Planning a hike involve looking at the distance and the elevation total for that hike. Yet, distance and elevation totals will not always provide an accurate representation of how a hike will feel to an individual hiker. A person must look at the distribution of that total elevation gain.
For instance, a hike that has a steady climb to the peak will have a more different level of difficulty for the hiker than a hike that has a series of short, steep climbs that require the hiker to continually climb upwards during the hike. In these cases, the measurement of elevation gain per mile can provide hikers with a way of comparing the difficulty of these different hike. Elevation gain per mile is a calculation that a person can make by dividing the total elevation gain of a hike by the total distance of that hike.
Use Elevation Gain Per Mile to Compare Hikes
The result of this calculation can provide a hiker with a figure of the “raw” gain of the route. However, raw elevation gain per mile does not account for every factor that may increase the load that a person must perform while on the hike. For example, the factor of descent is one that can increase the load that a person must perform by engaging the muscle in the legs.
Other factors may be the weight of the individual’s pack, the altitude of the hike, the variability of the trail grade, and the presence of switchbacks on that hike. To calculate adjusted climb density, a hiker must enter several different factor into the calculator. Factors include total gain, distance, descent, pack weight, highest elevation, grade variability, and switchback factor.
Each of these factor will adjust the raw gain per mile to reflect the actual condition of the hike. For example, descent will add a braking allowance for the leg muscles, pack weight will increase the effort that must be performed with each step due to the weight of that pack, and the factor of high altitude will reduce the amount of oxygen that reach the body. Similarly, grade variability will increase the total load on the body due to the varying terrain of the hike, and the switchback factor will allow for the total grade to be adjusted for the number of switchbacks on that trail.
This adjusted climb density will then be the number that best represents the actual experience that the hiker will have on the hike. Each of the various factor can be used to determine which hiking routes may be appropriate for a hiker based off their conditions. For instance, a person can determine total gain from the route profile of the hike.
Distance can be used to determine if an individual can fully complete the hike based on total gain. Descent is important for hikers to consider because many may not consider the impact that long descents has upon the knees. Pack weight is a factor that can be considered because each pound of added weight to a hiker’s pack increases the effort that must be performed with each step of the hike.
The highest elevation is a factor that can be considered to determine how much of an impact that high altitudes will have upon a hiker’s body. Each factor can be considered to determine which route is appropriate based upon the conditions of the hiker. Most mistakes that hikers may make with the calculation of adjusted climb density include not accounting for descent on one route compared with another, the variability of the trail grade, or the weight of the individual’s hiking pack.
For example, it is possible that one route may appear to have a moderate amount of gain per mile, yet have a descent that is challenging to many hikers, yet another route may have a high amount of raw gain per mile but use many long switchbacks that allow for an easier hike. Thus, while the calculator does not account for physical fitness or weather conditions on the hike, it does account for the “hidden” loads that is placed upon an individual while hiking on these routes. There are also reference tables that provide recommendations for the difficulty of various hikes.
For example, easy routes generally have less than three hundred feet of gain per mile, while very hard routes have more than nine hundred feet of gain per mile. Additionally, hikes in the middle of those ranges may be classified as either moderate or hard based upon whether the gains is steady or instead broken into short sections. Furthermore, the style of the hike can impact how an individual feels the load of that hike, especially when it comes to short hikes versus long hike with backpacking gear.
The measurement of adjusted climb density can help hikers to compare their hiking goals to their current physical conditions. For instance, if a hiker is loading heavy gear or if it is hot out, they may opt for a route with a lower adjusted climb density. Similarly, if an individual is well-rested and with a light pack, they may choose a route with a higher adjusted climb density.
Thus, while the elevation gain per mile for each route will remain the same, the decision of which route to take will change according to the conditions of the hiker. Therefore, adjusted climb density does not provide a means of determining whether a hiking route is good or bad, but instead, elevation gain per mile can help an individual to understand how the map of the trail will feel when they begins to hike on that route. By understanding adjusted climb density, hikers can understand the hike that they will experience based upon the number that is calculate.