Contour Interval Elevation Calculator
Estimate contour interval, total elevation change, target contour elevation, slope grade, and map spacing from labeled index contours or field-measured map distance.
Contour calculation results
| Contour interval | Index-to-index rise | Best map terrain | Planning note |
|---|---|---|---|
| 5 ft / 1.5 m | 25 ft / 7.6 m | Very flat campground, floodplain, dunes | Shows subtle drainage and small benches |
| 10 ft / 3 m | 50 ft / 15.2 m | Rolling forest, low hills, parks | Good for campsite and trail approach checks |
| 20 ft / 6.1 m | 100 ft / 30.5 m | Most USGS hiking areas | Balanced detail for route planning |
| 40 ft / 12.2 m | 200 ft / 61 m | Mountain and canyon maps | Steep terrain can hide short cliffs |
| 80 ft / 24.4 m | 400 ft / 121.9 m | Large relief overview maps | Use only for broad route screening |
| Map scale | 1 inch on map | 1 cm on map | Common use |
|---|---|---|---|
| 1:10,000 | 833 ft / 0.16 mi | 100 m | Orienteering and detailed site plans |
| 1:12,000 | 1,000 ft / 0.19 mi | 120 m | Orienteering and park navigation |
| 1:24,000 | 2,000 ft / 0.38 mi | 240 m | USGS 7.5 minute topo sheets |
| 1:25,000 | 2,083 ft / 0.39 mi | 250 m | Metric hiking maps |
| 1:50,000 | 4,167 ft / 0.79 mi | 500 m | Regional forest and expedition maps |
| Average grade | Feet per mile | Meters per km | Outdoor meaning |
|---|---|---|---|
| 0% to 5% | 0 to 264 ft | 0 to 50 m | Gentle walking or easy trail |
| 5% to 10% | 264 to 528 ft | 50 to 100 m | Noticeable climb with steady effort |
| 10% to 15% | 528 to 792 ft | 100 to 150 m | Strong climb, slower hiking pace |
| 15% to 25% | 792 to 1,320 ft | 150 to 250 m | Steep route, switchbacks likely |
| 25%+ | 1,320+ ft | 250+ m | Very steep; check cliffs and exposure |
| Project or route check | Typical contour task | Inputs to verify | Reliable method |
|---|---|---|---|
| Camp approach | Estimate climb from parking to site | Route length, crossed contours, map scale | Calculate grade from total route distance |
| Ridge traverse | Confirm minor saddles and high points | Index labels, direction, target spaces | Count from nearest labeled contour |
| Canyon descent | Check loss before stream crossing | Upper index, lower index, contour spacing | Use downhill mode and map distance |
| Off-trail basin | Compare slope lines before committing | Map distance across same number of contours | Smaller spacing means steeper slope |
| Metric topo | Convert map elevation to GPS units | Meters, contour interval, route km | Keep the calculator in metric mode |
Backcountry mishaps aren’t usually caused by getting lost in a straight line. They’re caused by underestimating difficulty of vertical travel. You see on your map a gentle-appearing ridge, and then find a series of tight contour lines that make for more ladder-climbing than hiking. Interpreting exactly what these thin brown lines mean in 3-D space can be the difference between a fun afternoon adventure and a grueling slog.
Understanding how to use a topo map isn’t so much learning a set of rules as it is turning a flat map into physical movement. You begin by locating the “contour interval,” which is the change in height between any two lines. In our example, there are five spaces between two numbered index contours, one at 640′ and one at 840′. Meaning there is a 40-foot increase per line. Everything else stems from that figure. From here, you know if you’re dealing with a gentle rise or vertical wall.
How to Read a Topo Map
The calculator above will do all the arithmetic for you when you input your own measurements. This prevents mistakes from mental math done while bracing against wind trying to read a map. Now that you know the interval, you’ll be able to guess at your position in respect to your destination. Multiply whatever number of contour spaces you’ve traversed without labels by the interval and you’re within about a hundred feet (maybe a little more) of elevation gained, which is great because it will help you pace yourself, guessing whether you’ll encounter another tree line around the next corner, if there’s a chance of water still being available in that upcoming creek.
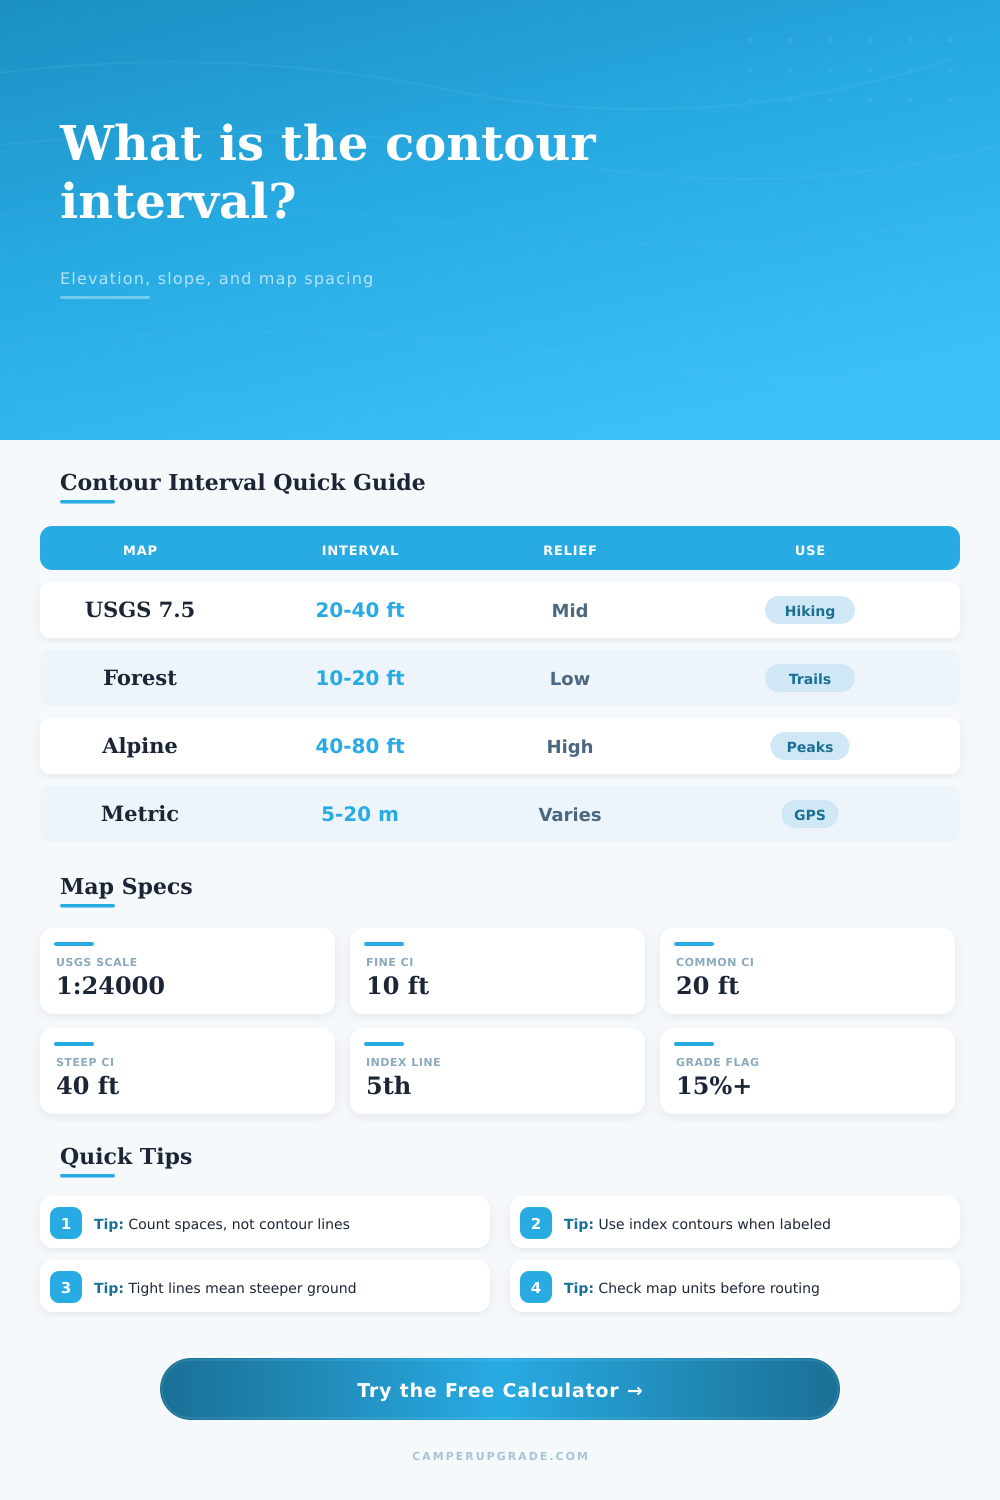
The page’s reference tables illustrates typical situations: A forested area with a ten-foot interval reveals gradual drainage while an alpine slope with an eighty-foot one masks treacherous mini-cliffs beneath wide arcs. But here’s where things get tricky: Grade also involves horizontal distance. It doesn’t matter if you gain 100 feet vertically across one mile; that’s no sweat. But 100 feet over a quarter mile? That will punish you.
That’s why ruler measurement of map distance is important, it lets you calculate what this distance means in terms of real world ground distance. With the map scale, you can translate that paper distance into an actual distance on the ground. Then, you can compare that distance to amount of vertical gain. That gives a slope percentage that represents actual effort.
The difference between the route and straight-line grade can be confusing. For instance, a long switchbacking trail that goes up a hill will cross the same contour lines as a direct line to the top. However, the trail travels many more feet horizontally, which decreases its effective grade considerabley. Make sure to always consider the true distance along the trail, not simply the crow-flies distance, when planning your trip. You’ll notice the distinction on this tool and whether your planned route relieves some of the work, or multiplies it.
Sometimes the map reads perfectly, sometimes not so much in field conditions. Paper maps can get dusty and obscured while fog creeps over the peaks and hides them from view. In those moments, counting contour spaces become a survival skill. Play a counting game: How many contours have I just passed? Am I still descending into a drainage basin, or am I ascending out of one? Or am I moving towards a saddle? One little thing to anchor your confidence as you lose sight.
At the end of the day, however, maps are nothing more than snapshots of a moving target. Numbers comes from the calculator; the context comes from you. Take a good look at those lines, how tightly bunched together are they? The closer the lines are, the steeper they is, which means more effort. How widely spaced are they? This mean easier terrain and an opportunity to regain your strength.
When you marry solid interval math with a realistic estimation of your endurance, you transform a sheet of paper into something you can trust: a travel companion who prevents you from guessing your way through the climb and instead respects it so that ascending up to camp is every bit as enjoyable than descending back from it. You should of looked closer at those lines first.