Campground WiFi Bandwidth Per Site Calculator
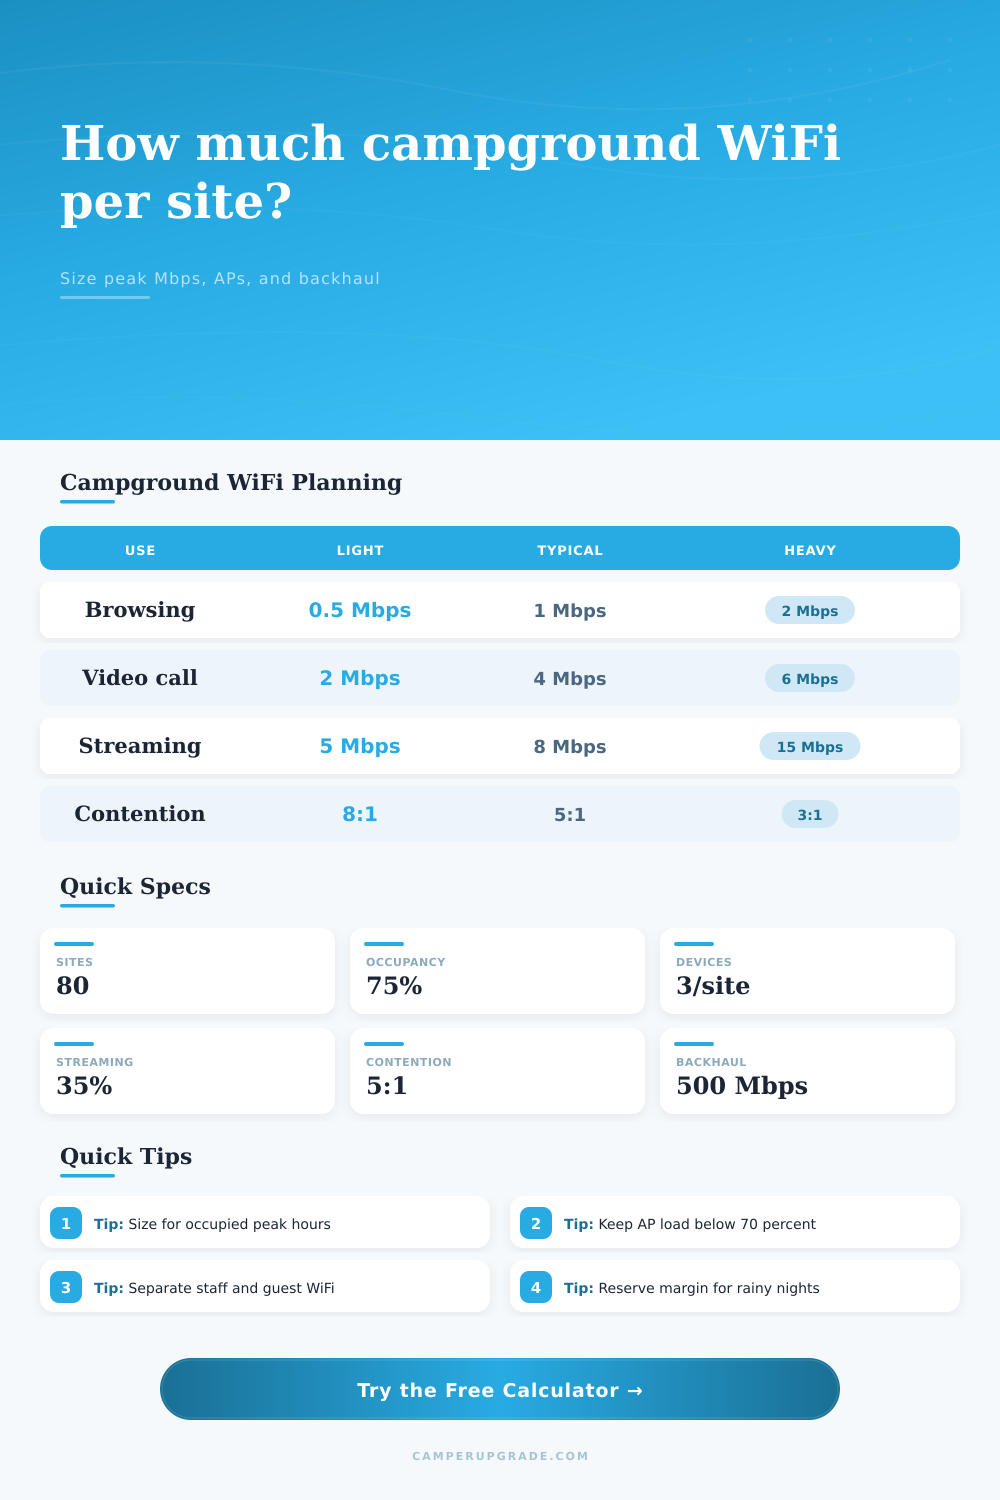
Estimate peak bandwidth per occupied campsite, shared backhaul demand, access point load, and reserve margin from occupancy, device count, use mix, streaming share, contention, and peak hour behavior.
The calculator blends Mbps per device by use, applies streaming share, then divides shared demand by the contention ratio. Peak hour factor represents how much of the occupied-device base is active at the busy hour.
Bandwidth Estimate
| Guest use type | Planning Mbps per active device | Notes for campgrounds | Latency sensitivity |
|---|---|---|---|
| Browsing, email, maps | 0.5 to 2 Mbps | Often bursty, usually helped by caching and good DNS response. | Low |
| Video calls and remote work | 2 to 6 Mbps | Upload and jitter matter, especially for campers working from RVs. | High |
| Online gaming and app updates | 1 to 5 Mbps | Game play is latency-sensitive; downloads can create short bursts. | Very high |
| HD streaming | 5 to 8 Mbps | Evening streaming usually drives the busiest campground hour. | Medium |
| 4K streaming | 15 to 25 Mbps | Use only for premium cabins or parks intentionally supporting 4K. | Medium |
| Contention ratio | Best fit | What it assumes | Risk if undersized |
|---|---|---|---|
| 2:1 | Premium cabin or work-friendly rows | Most active guests can use service at the same time. | Low |
| 3:1 to 4:1 | Strong managed campground Wi-Fi | Heavy evening use with reasonable shared behavior. | Moderate |
| 5:1 to 8:1 | Typical guest Wi-Fi across mixed sites | Streaming, browsing, and calls overlap but not constantly. | Moderate to high |
| 10:1 to 15:1 | Basic browsing or limited rural backhaul | Guest expectations are low and streaming is constrained. | High |
| AP environment | Usable Mbps per AP | Good planning target | Guest experience note |
|---|---|---|---|
| Indoor cabin AP | 120 to 250 Mbps | 65% to 75% | Short range, better signal, easier reuse between buildings. |
| Outdoor sector AP | 150 to 350 Mbps | 60% to 70% | Plan for trees, RV bodies, distance, and client radio quality. |
| Mesh repeater AP | 60 to 150 Mbps | 50% to 65% | Each wireless hop can reduce effective throughput. |
| High-density lodge AP | 250 to 500 Mbps | 65% to 75% | Often limited by client count before raw Mbps is reached. |
| Campground model | Inputs | Peak Mbps per occupied site | Planning note |
|---|---|---|---|
| Small rustic camp | 30 sites, 2 devices, 20% streaming | 1.1 to 2.0 Mbps | Basic backhaul can work if video quality is limited. |
| Family RV park | 80 sites, 3 devices, 35% streaming | 2.5 to 4.5 Mbps | Evening demand usually drives the design. |
| Remote-work resort | 120 sites, 3.5 devices, 25% streaming | 4.0 to 7.0 Mbps | Upload capacity, jitter, and AP density matter. |
| Premium cabin row | 24 units, 5 devices, 55% streaming | 8.0 to 14 Mbps | Plan stronger contention and dedicated AP coverage. |
100 Mbps
Best for small parks, light browsing, low streaming share, or strong guest shaping.
250 Mbps
Fits many small to mid-size parks when peak occupancy and streaming are moderate.
500 Mbps
Comfortable target for mixed RV parks with HD streaming and managed contention.
1 Gbps
Better for large resorts, cabins, rainy-weekend streaming, and remote-work guests.
I know it’s going to rain, because I feel the storm coming long before any water falls from the sky. Guests feel it too. It’s that period of calm before wind picks up, the barometer lowers, and everyone want to watch Netflix or FaceTime a friend. That is what makes or breaks your guest network.
Unfortunately, many campgrounds don’t realize how much of an issue this can be when designing their networks. With this page’s calculator, all you need to do is input number of sites and expected devices, and it will tell you whether your existing internet service can handle a crowded night.
Why Campground Wi-Fi Fails When It Rains
Speed isn’t the problem with campground Wi-Fi, the problem is contention. Even if your Wi-Fi was lightning fast, it would be slow for everybody if 30 people is using it simultaneously. Think of it like a tiny path through forest. If two person use the path, they move along fine. But when 20 people get there, nobody gets anywhere.
This tool (available on this page) will help you see how much bandwidth different types of online activity consume. It helps you picture the bandwidth bottleneck and how streaming, work, and browsing adds up to one big peak estimate. And not all data consumes the same amount of bandwidth. Email doesn’t consume much bandwidth. A Zoom conference call consumes a bit more. 4K video consumes most.
Five-hundred-megabit-per-second broadband sounds good to most owners. They think it’s available for all guests. But it doesn’t work that way. It’s a shared pool. Enter your device count and occupancy rates into the calculator to see how much of the pool goes to each site.
In reality, when everybody’s on at peak hours, available bandwidth per occupied site plummet. And the peak hour is key: That’s when kids are watching cartoons, teens is gaming and parents are working.
Physical limitations include access points, which is also limiting factors. No matter how many bits per second feed the access point via the backhaul, there’s a limit to the number of bits per second an outdoor access point can handle. If you overload the air interface, the system will still slow due to no fault of the internet connection.
You want to keep the load on any given access point under seventy percent with a safety margin. That means that there is space to account for retries and other interference from rain, trees, metal RV roofs, etc. These limits are listed in the reference table on the page, so you can determine whether or not you need faster than fast internet, or additional hardware.
Usage patterns are changing with remote workers. For campers, it’s not just about looking at maps anymore: They’re also running apps in the cloud, and uploading files. Speed isn’t everything, latency matter too. These folks aren’t going to tolerate a fast (but jittery) connection. Instead, they prefer a slow-but-steady.
Use the tool to dial-in for work use, and shift planning emphasis to reliable performance rather than raw output. Market yourself as remote-work friendly? Prove you can support video conferencing without dropped frames.
Finally: Do not overlook the rainy night scenario. This can be your stress test. If you plan for average usage, guess what? That’s where you’ll find yourself disappointed. Size up the network for worst case. Add a cushion. And keep the staff network separate from the guest network. Even if the guest network is clogged by streaming activity, the front desk still need reliable access to check people in.
Yes, extra capacity adds an upfront cost. But it also preserves your reputation when the storms comes. Guests don’t just want the internet; they want to be connected to the experience of being disconnected.