Campground Site Density Calculator
Estimate practical campsite count, sites per acre, buildable acreage, and layout pressure from setbacks, roads, bathhouse or common land, unbuildable slope, pad size, buffers, and site type mix.
🗺Layout Presets
📐Land And Dedication Inputs
🛻Site Mix And Spacing
📊Comparison Grid
🧭Density Snapshot
📏Site Type Envelope Reference
| Site Type | Pad Multiplier | Typical Buffer | Density Effect |
|---|---|---|---|
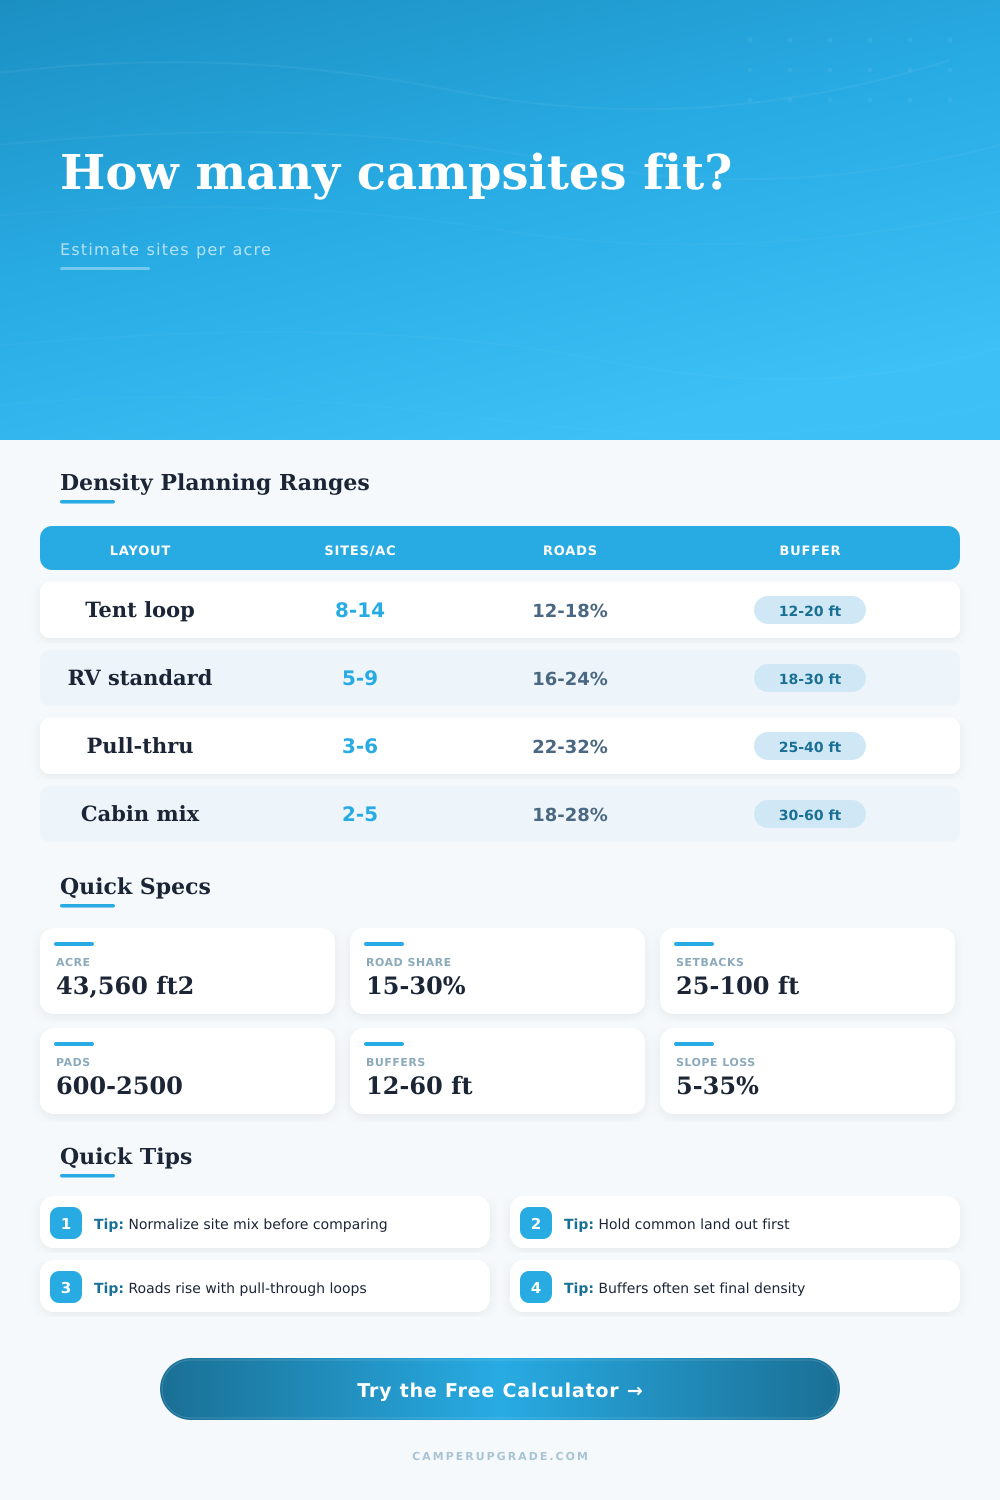
| Tent or primitive pad | 0.65 x average pad | 12 to 20 ft | Highest count when roads and shared parking stay compact. |
| Standard back-in RV | 1.00 x average pad | 18 to 30 ft | Balanced count for mixed family campgrounds. |
| Pull-through or large RV | 1.35 x average pad | 25 to 40 ft | Lower count because pads, turning lanes, and road area expand. |
| Cabin or glamping unit | 1.65 x average pad | 30 to 60 ft | Lowest count when decks, parking, fire areas, and view spacing are included. |
🛣Road And Common Area Benchmarks
| Campground Pattern | Road Area Range | Common Area Range | Planning Note |
|---|---|---|---|
| Simple one-way tent loop | 10% to 18% | 0.25 to 1.0 acres | Works when parking, trash, bathhouse, and play space are clustered. |
| Mixed RV and tent campground | 16% to 24% | 0.75 to 2.5 acres | Often needs wider intersections, bathhouses, dump area, and activity lawn. |
| Pull-through RV park | 22% to 32% | 1.0 to 3.0 acres | Road geometry and entry stacking can drive the final density down. |
| Resort or cabin-heavy park | 18% to 28% | 2.0+ acres | Reception, pool, laundry, dog park, event lawn, and service yards take land first. |
⛰Setback And Unbuildable Land Guide
| Constraint | Light Impact | Moderate Impact | Heavy Impact |
|---|---|---|---|
| Perimeter setback | 25 to 40 ft | 50 to 75 ft | 100 ft or more |
| Slope or grading loss | 5% to 10% | 12% to 25% | 30% to 50% |
| Wetland or drainage buffer | 0% to 5% | 5% to 20% | 20% or more |
| Odd parcel shape | Little count loss | Some loop inefficiency | Many fragments or dead ends |
🏕Common Density Examples
| Example Layout | Gross Density | Typical Mix | Best Use |
|---|---|---|---|
| Compact tent campground | 8 to 14 sites per acre | Mostly tent pads, shared parking, modest buffers | Simple loops, hike-in zones, and primitive camping areas. |
| Family mixed campground | 5 to 9 sites per acre | Tent, back-in RV, a few cabins or premium pads | Balanced amenities and practical circulation. |
| Large RV pull-through park | 3 to 6 sites per acre | Long pads, wide roads, more turning space | Big rigs, one-night stops, and highway-adjacent parks. |
| Low-density cabin resort | 2 to 5 sites per acre | Cabins, view buffers, common amenities, trail space | Privacy, scenery, decks, and destination-style stays. |
📘Formula Notes
Buildable acres = setback-adjusted parcel acres x (1 - unbuildable percent) - adjusted roads - bathhouse/common acres.Average site envelope = weighted pad size plus two-sided buffer spacing around a square-equivalent pad.Practical sites = floor(raw sites x (1 - planning reserve percent)).
💡Density Planning Tips
Take this example: you purchase 20 acres of woods with a creek, some pines, and dream of having it filled out by July. On paper the math seems great, but then you draw in roads and setbacks, and want some privacy too, and pretty soon you’re down to just a fraction of your land, before you’ve even set down a single piece of gravel.
How many sites fit on the property isn’t what site density is realy about. It’s not about how much space you can get out of a given area. Rather, it’s about how little space you’re willing to give away for infrastructure, circulation, and the overall guest experience. And that makes all the difference.
How to Count Your Real Camp Sites
To find out what’s actualy left to develop, just plug your numbers into the calculator above. It’ll do the math for you. The numbers begins with your total acreage; then get interesting when you deduct unseen expenses of development.
First off is the perimeter setback. That’s the stuff around the edges. Maybe you’re required by zoning. Or maybe you have a buffer zone to preserve the nearby woods. Either way, no tent go there.
Next is your road network. Fifteen percent of your buildable space can be devoted to a basic loop. Throw in big-rig pull-throughs, and you’re looking at 30% (or more) of your buildable space dedicated to roads. Long vehicle require generous turning circles. And this geometry consumes land in ways that surprise you.
Common areas are another quiet density killer. You’ve got to have room for check-in lanes, trash dumpsters, bathhouses, perhaps a little playground. Unless you hold out that land first, before you even start putting in sites, you’re going to be squishing sites in around the dumpster and in front of septic tank. This is a design mistake. With the tool, you can take off those acres at the beginning, when the count is still meaningful. And therefore realistic.
The same applies to slope and other unbuildable zones. Wetlands, steep ground, drainage swales isn’t just aesthetic headaches. They’re physical and legal obstacles. Mess with them, and your site count will be straight-up fiction.
After cleaning up the land, we’ll know what the total envelope will be based off the combination of sites. For example, a resort-style cabin park needs lots of space for vehicles, decks, and privacy; it will have wider buffers. Tent loops can be closer together with shared amenities. By weighting your preferred mix, the calculator balance this difference. Maybe you prefer 80% RV sites and 20% cabins. The math will adjust the average square footage accordingly to account for this blend. This avoids mistake of assuming all sites are equal. They’re not.
The last sanity check is planning reserves. Until you encounter a cluster of protected trees or an insurmountable layer of rock, raw division math appear rosy. To reflect the fact that we live in the real world, include a reserve of 10-15 percent. This is what separates theory from practice. What’s buildable vs. It’s what looks good on paper. And it all plays out through the reference tables on the page.
Why, yes, a compact tent loop provides more sites per acre then a pull-through park. How could that be? It is not a flaw in the land, but just a characteristic of the vehicle. Most developers want to pack as many sites into their land as possible (more sites = more money). This happens until it becomes so crowded that reviews suffer.
Remember: guests don’t pay by square footage. They pay for a spot on your property. When your spacing gets too close, one guest can overhears the conversation of another. When your roads are too narrow, visitors back in and block traffic. Density sends an unspoken message about the whole experience. Too high and it’s like a motel. Too low and it’s like a retreat.
What will you sell? What does that mean for the land? How much do you need? The calculator defines the range of possibility. It shows you the price of convenience. It shows you cost of privacy.
Run some scenarios. See what happens if you add a cabin wing. See how many more RVs it lets in. See how big a road allowance really needs to be. How much land does it eat up?
Let the numbers drive the form. When you know the tradeoffs, you stop guessing and begin to plan. There is only so much land. And whatever fits depend on your choices. That’s where the real density lies.