Camper Battery Replacement Cost Per Year Calculator
Annualize RV battery replacement by chemistry, usable capacity, cycle life, calendar life, depth of discharge, and temperature derating.
Annualized replacement results
Full formula breakdown
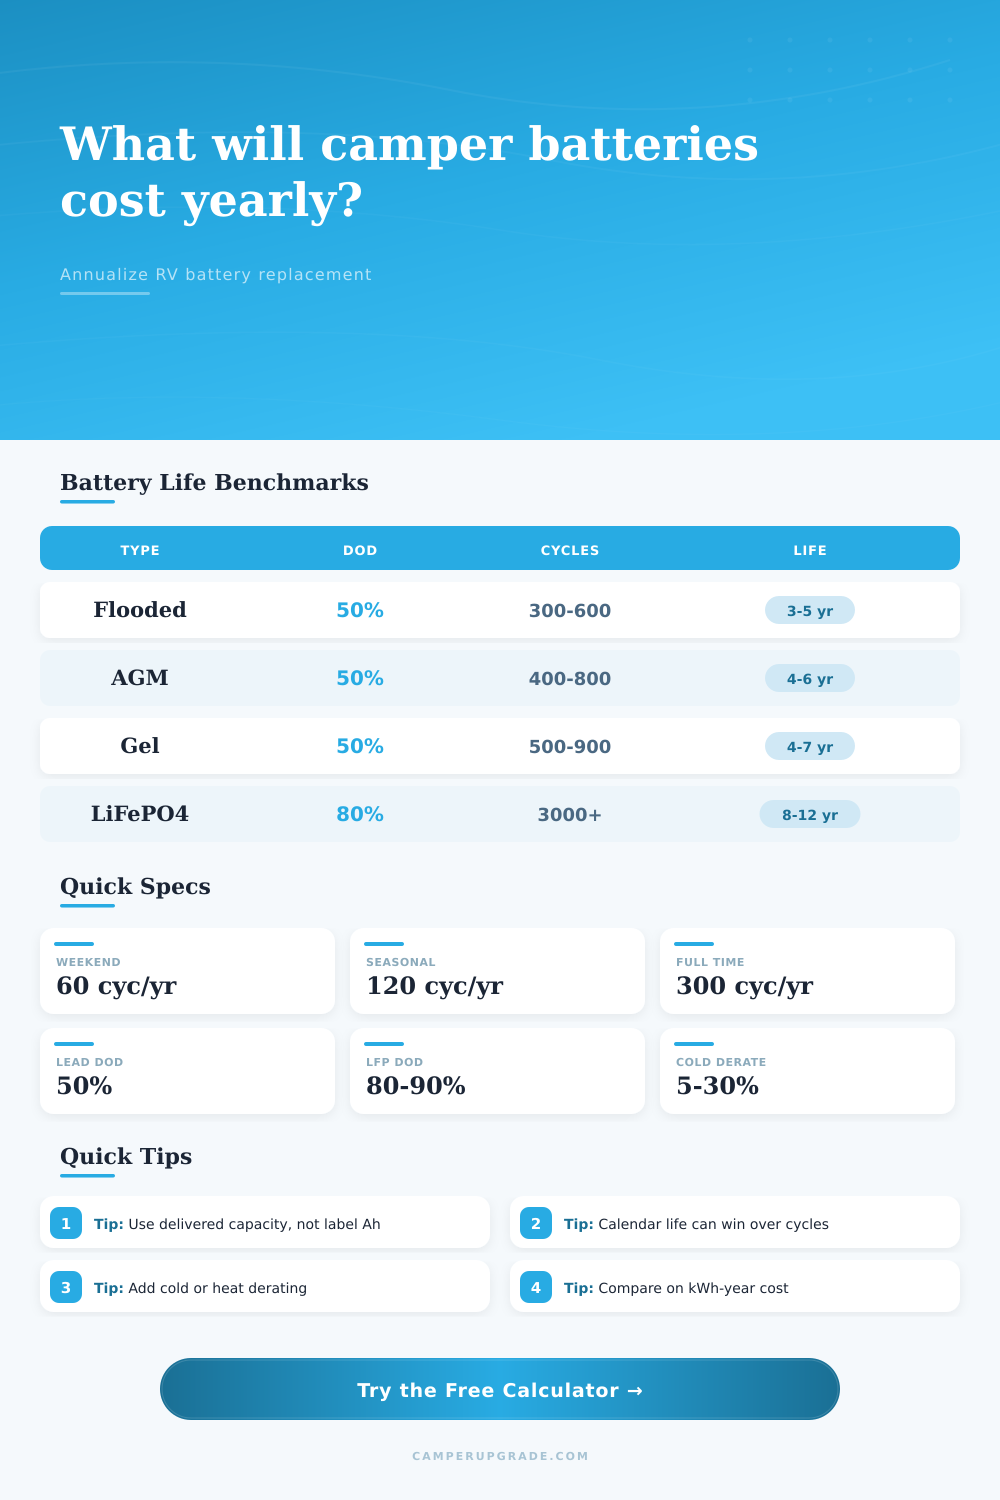
| Battery type | Common camper DoD | Typical rated cycles | Calendar life planning |
|---|---|---|---|
| Flooded lead acid | 40% to 50% | 300 to 600 | 3 to 5 years if watered and charged well |
| AGM lead acid | 45% to 60% | 400 to 800 | 4 to 6 years in moderate temperatures |
| Gel lead acid | 45% to 60% | 500 to 900 | 4 to 7 years with correct charge voltage |
| LiFePO4 lithium | 80% to 90% | 3000 to 5000 | 8 to 12 years, BMS and storage dependent |
| Custom pack | User supplied | User supplied | Use the battery maker cycle chart |
| Use pattern | Cycles per year | Common bank | Replacement pressure |
|---|---|---|---|
| Weekend trips | 40 to 80 | 100 to 200 Ah | Calendar life often limits replacement |
| Summer seasonal camping | 90 to 150 | 200 to 300 Ah | Cycles and heat both matter |
| Monthly boondocking | 120 to 220 | 200 to 400 Ah | Depth of discharge becomes important |
| Remote work camper | 220 to 320 | 300 to 600 Ah | Cycle life strongly affects annual cost |
| Full-time RV | 280 to 365 | 400 Ah or larger | Lithium often wins on kWh-year cost |
| Battery condition | Derate to enter | What it represents | Planning note |
|---|---|---|---|
| Interior battery box | 0% to 5% | Mild temperatures near rated capacity | Good baseline for protected batteries |
| Cool shoulder season | 5% to 15% | Reduced cold-weather available capacity | Use battery case temperature when possible |
| Freezing nights | 15% to 30% | Lead capacity loss or lithium heater overhead | Charging limits may matter more than runtime |
| Hot exterior compartment | 10% to 25% | Accelerated aging from heat exposure | Reduce calendar life if heat is sustained |
| Metric | Formula | Why it matters | Example cue |
|---|---|---|---|
| Rated energy | Ah x V / 1000 | Converts camper battery labels into kWh | 200 Ah at 12 V is 2.4 kWh |
| Usable kWh | Rated kWh x DoD x derate x reserve | Shows energy you can actually plan around | Lead banks usually count less capacity |
| Cycle-limited years | Rated cycles / cycles per year | Finds wear from repeated discharge | Heavy boondocking shortens the interval |
| Replacement interval | Lower of cycle years and calendar years | Prevents overestimating long-lived batteries | Stored batteries still age over time |
| kWh-year cost | Annual cost / usable kWh | Compares unlike battery sizes fairly | Useful for AGM versus LiFePO4 choices |
A lithium battery bank comes with a hefty sticker price but when you look at the yearly cost, it’s a different story. After spending all your money on one, you may think your wallet is empty but that’s only half the picture. Most people focus on the upfront investment when buying for an RV and don’t consider the long game.
Batteries aren’t forever. They have an end of life. They get old and die. How much do batteries cost you each year? That’s more than just the purchasing price. Plug in your temperature conditions and cycle habits. The calculator does the rest.
The True Cost of Owning a Battery
No guessing which battery will last longer, just compare them side-by-side. If you’re like me, you might be tempted by the lower sticker price on a cheap flooded lead acid battery. But you need to water it, replace it more frequently, and it’s only half as good due to depth of discharge limits.
Plug those invisible expenses into the calculator and it annualizes them for you, giving you a clear view of the true cost per year. That shifts the purchase decision from one driven by emotion to a sound financial strategy.
Where most folks fall down is depth of discharge. Lead acid batteries don’t take kindly to deep discharges. You shouldn’t drain more than roughly half of its rated capacity or it will degrade rapidy. By contrast, lithium iron phosphate batteries can be discharged far more deeply, sometimes as deep as eighty to ninety percent.
That allows a smaller lithium pack to produce the same amount of usable energy as a much bigger lead bank. To account for that in the calculation, we convert rated amp hours to usable kilowatt hours. In other words, if you neglect this variable, you’re comparing apples to oranges: raw capacity vs usable power. What you want to know is how much actual energy you’ll be able to use without harming battery.
Batteries has calendar life, that’s how long they last regardless of usage. Even when sitting on a shelf, they slowly break down due to chemical changes and high temperatures that speed up their failure. Lower temperatures decrease usable capacity, and yes, you can enter a temperature derate factor into the tool to reflect where it is stored. Storing in a cold unheated garage will result in reduced capacity due to cold, while parking in hot summer desert weather will cause it to age more quickly. Each will reduce the replacement interval.
Battery replacement interval comes from whichever has the shortest lifespan (calendar or cycle). So it won’t let you plan too optimistically for either.
There is one thing to keep in mind: Weekend warriors have different needs than full-time RVers. For example, if you are going off-grid everyday and cycling your battery hard, you want one with high cycle counts. Lithium batteries lasts thousands of cycles, while lead acid might last only a year or two if used like that. This causes the difference between the two, which is shown in the calculator by adjusting the annual cost based on the number of cycles per year you estimate you’ll get.
So for someone who camps mostly weekends, they may find that lead acid looks competitive due to calendar life limiting them from replacing anyways. Someone who is a full-timer will see that even though they pay more up front, lithium saves them money over time. Break-even depends on how much you use it.
Some batteries carry an installation fee. Others have core fees that you must pay when replacing. Those recurring costs add up if you keep them long enough. 10 years). This tool will look at those costs as well and include them in the replacement price.
What this does is provide a true picture of how much it’s going to cost to own something. Sure, you might be able to get a cheaper battery. But you’re not getting a battery, you’re buying the service of the battery for X number of years. If you divide the total cost by the number of years the service lasts, it provides a fair comparison. It evens the playing field between expensive and cheap.
So use that as a mental exercise: Do you really have three hundred amp hours? Because maybe you’re oversizing for peace of mind, and the calculator helps you size down to what makes sense for you. How many usable kilowatt hour years do you get for your money? That’s the cost-per-usable-kilowatt-hour-year. It removes all marketing hype and leaves you with raw economics.
This way, you can see exactly how much each dollar of performance will cost you in the long run. It’s not who has the best batteries, but rather which ones match your budget and lifestyle.
Use the presets if you’re not sure where to start. That’ll at least get you in the ballpark. Adjust up or down based off what you think your real-world consumption is and what your local climate is like. Because it’s all about accuracy: rough estimates produce rough decisions. Precise calculations build confidence.
You’ll have exact knowledge of how much juice your battery is costing you; and when to swap it out. You will no longer have to guess.
If you care about the total cost of ownership, ignore the upfront cost. It’s an illusion. Focus instead on the annualized cost: this helps you stop paying for features you don’t need. And it prevents you from overlooking the costs that are invisible to you. It allows you to decide with data rather than with hype. This explains the tradeoffs and uncovers the hidden costs. And it lets you go to bed at night feeling good about your battery budget.