Campground Utility Cost Per Site Calculator
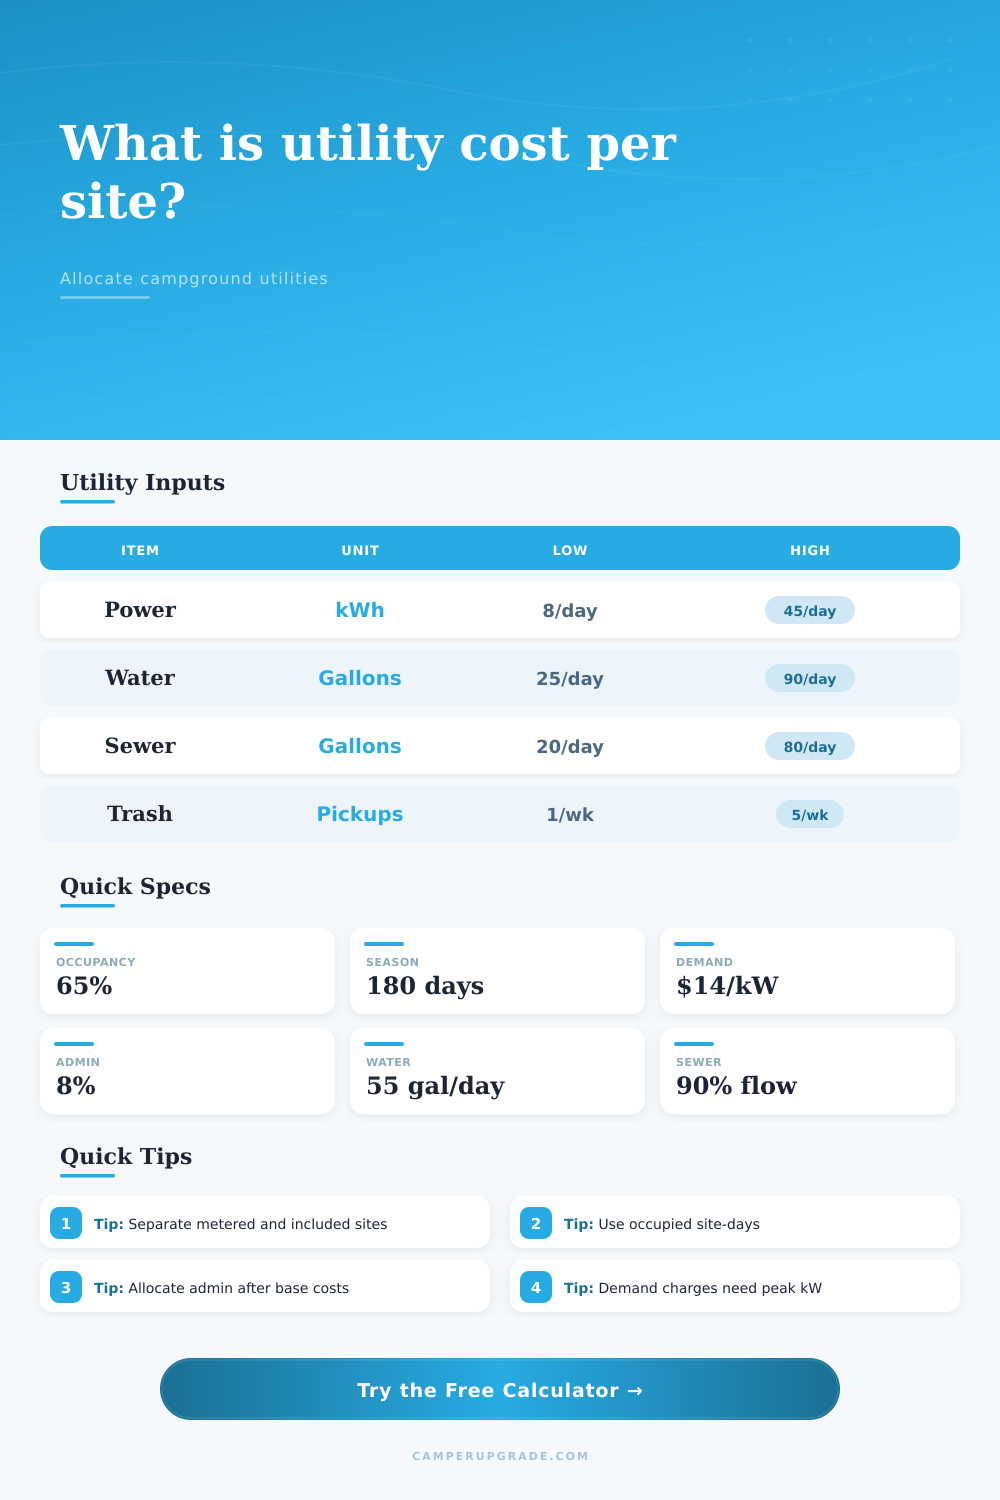
Allocate electric, water, sewer, trash, demand charges, and admin overhead by occupied site-day, total site inventory, or metered-pass-through rules.
🏕Utility Presets
📋Sites, Occupancy, And Allocation
⚡Electric And Demand Charge
🚰Water, Sewer, Trash, And Admin
Utility Allocation Breakdown
📊Current Utility Snapshot
🧮Comparison Grid
Included Utilities
$0All utility cost stays in the site-rate allocation.
Metered Electric
$0Electric energy is recovered from guests except fixed and demand costs.
Allowance Billing
$0Only usage above the included kWh allowance is recovered.
High Occupancy Test
$0Shows net cost if occupancy rises by 15 percentage points.
📘Typical Utility Use Reference
| Site or season profile | Electric kWh/site-day | Water gallons/site-day | Allocation note |
|---|---|---|---|
| Primitive or no-hookup tent sites | 0 to 3 | 5 to 18 | Restroom and bathhouse loads often belong in admin or shared utility allocation. |
| Water and electric weekend sites | 8 to 22 | 25 to 55 | Short stays usually have lower laundry use but more arrival cooling spikes. |
| Full hookup RV shoulder season | 14 to 30 | 40 to 75 | Water heater, converter, fridge, and moderate climate loads drive the middle range. |
| Hot weather full hookup RV sites | 30 to 60 | 55 to 95 | A/C compressor duty and extra shower use can dominate the allocation. |
⚡Electric Billing Modes
| Billing mode | Guest pays | Park retains | Best use case |
|---|---|---|---|
| Included in site rate | No separate electric line | Energy, demand, fixed service, and admin | Short-stay parks where separate meter reads slow check-in or check-out. |
| Metered electric | Measured kWh multiplied by posted rate | Unrecovered kWh, fixed service, demand, and admin | Monthly, seasonal, and long-stay RV sites with individual meters. |
| Included allowance | Only kWh above the included allowance | Allowance energy plus fixed service, demand, and admin | Hybrid plans that include normal use but protect against heavy A/C or heat. |
| Active utility pool | Depends on site class | Shared restroom, bathhouse, pump, and lighting loads | Mixed parks with primitive sites, cabins, tent sites, and RV hookups. |
🚰Water, Sewer, And Trash Allocation
| Utility item | Common billing unit | Calculator field | Allocation caution |
|---|---|---|---|
| Water consumption | 1,000 gallons or CCF | Water gallons per site-day and water rate | Leaks, irrigation, pools, and bathhouses can make site allocation look too high. |
| Sewer treatment | 1,000 gallons or sewer equivalent unit | Sewer billable flow percent and sewer rate | Some utilities bill sewer from water use, while septic hauling may be per pump-out. |
| Trash hauling | Pickup, dumpster, roll-off, or monthly invoice | Trash and recycling service total | Holiday weekends and group areas can create short spikes in disposal volume. |
| Admin allocation | Percent of subtotal or internal time study | Admin allocation percent | Meter reading, bill posting, payment handling, and dispute time are real overhead. |
📅Seasonal Days And Occupancy Examples
| Period | Seasonal days | Occupancy range | When to use |
|---|---|---|---|
| Peak holiday week | 7 to 10 | 90% to 100% | Stress-test trash, demand charge exposure, and short peak utility loads. |
| Monthly operating review | 28 to 31 | 40% to 95% | Compare utility invoices to reservation system occupied site-days. |
| Open season allocation | 120 to 240 | 45% to 80% | Build a blended site-day utility burden for seasonal budgeting. |
| Annual utility budget | 365 to 366 | 25% to 70% | Include off-season minimum bills, security lighting, pumps, and admin time. |
📐Formula Notes
Occupied site-days = total sites x seasonal days x occupancy percent.Electric subtotal = occupied site-days x kWh/site-day x $/kWh + peak kW x demand rate x demand months + fixed electric charges.Net utility cost per site-day = (gross utilities + admin allocation - guest electric recovery) / selected allocation site-days.
🧭Allocation Tips
Most campground owners discover they’ve made their utility math wrong when the July electric bill comes in. The air conditioners is on. The shower fills up. And then they look at their electric bill. The demand charge are higher than monthly rent for half of their inventory. That’s when you learn that dividing the total electricity bill by all sites, even if no one is occupying them, mean slow bankruptcy. Before setting your per-site rates, you must have an idea what a night on the ground cost you. So how do you go about it? Use the calculator above to handle the allocation logic, and concentrate on strategy.
The strategy is forcing yourself to break down your costs into variable versus fixed. What’s a variable cost? That’s what you pay for what you use: electricity (in terms of kilowatt-hours), water (gallons) and garbage (trash pickup). What’s a fixed cost? Those are your base bills regardless of whether there’s anyone in the park or not. Those are the fixed service fees for water and sewer line access. There are also demand charges, which is based off peak kilowatt usage rather than total energy consumed. This mix-up is the single biggest budgeting mistake managers make when running a hospitality business. It makes your profit margin per reservation impossible to see.
How to Calculate Your Utility Costs
Those numbers move on basis of occupancy. That means plugging in your average occupancy tells the tool how many days per site will be filled with guest who cover the fixed costs. There are one hundred sites with half occupancy. Each guest is not just paying for their own water and electricity; they’re also subsidizing vacant spot beside them. And if the subsidy is greater than room rate, the math gets ugly. So, the calculator wants your seasonal days. Why? Because a busy week in July isn’t the same as a slow Tuesday in November. Your utility costs vary by day of the year. Run the numbers for a stress test of full occupancy, will your demand charge eat your margin once the heat wave arrives?
Sewer and water are other expenses that can hide in the open. In most parks, it’s assumed that sewer flow equals water use. That doesn’t hold up in real life. Water used at the bathhouse for several sites will skew results. Leaky plumbing and irrigation of the lawn also skew things. By tweaking the sewer percent value on the tool, you can match sewer flow to actual water use. If your park features lots of trees and grass, such as in a campground setting, then more than just guest use will show up on your water bill. Should the excess water be considered part of site charge or handled as an operating overhead cost?
Same goes with garbage. Trash spikes disproportionately during holiday weekends. Spreading out the garbage costs over three hundred days softens the peak. This may work for annual budget purposes, but it does not work well when trying to analyze cash flows month by month. And then there’s the complexity of electric billing modes. To simplify things some parks bundle their electricity as part of site fee. This is great if your stay is short, but it is risky if it gets really hot or cold. Others bill electricity consumption directly by metering power used on a per kWh basis, moving the variable cost to the guest. The calculator models both.
If you choose to meter, how does that impact the fixed service fees and demand charges? Answer: those don’t magically go away because the guest now foots the kWh. Instead, they get shifted to other sites that aren’t billed. The result is a comparison grid showing how much cost will remain in the park regardless of the billing method. It underscores the tradeoff between what makes guests happy vs. Financially protecting yourself.
Admin overhead is the silent killer. There’s time spent on meter reading, billing, dispute resolution. The cost of all that work doesn’t factor into the net profit. Tacking on a tiny percent for administration recognizes the operational friction. When you’re working at thin margins, it’s a little line item that matters.
It’s a matter of getting the numbers right. And I don’t mean guessing; I mean knowing what you’re paying for. You give it context; the tool gives you the structure. Know when you use water and how much you use. Know what your peak loads are. Know what’s fixed, what’s variable. Do that, and you stop hoping the bills add up in the end: you’ll know they will. Air conditioners will run, but now you’ll know who’s paying for the breeze.