Campground Revenue Per Site Calculator
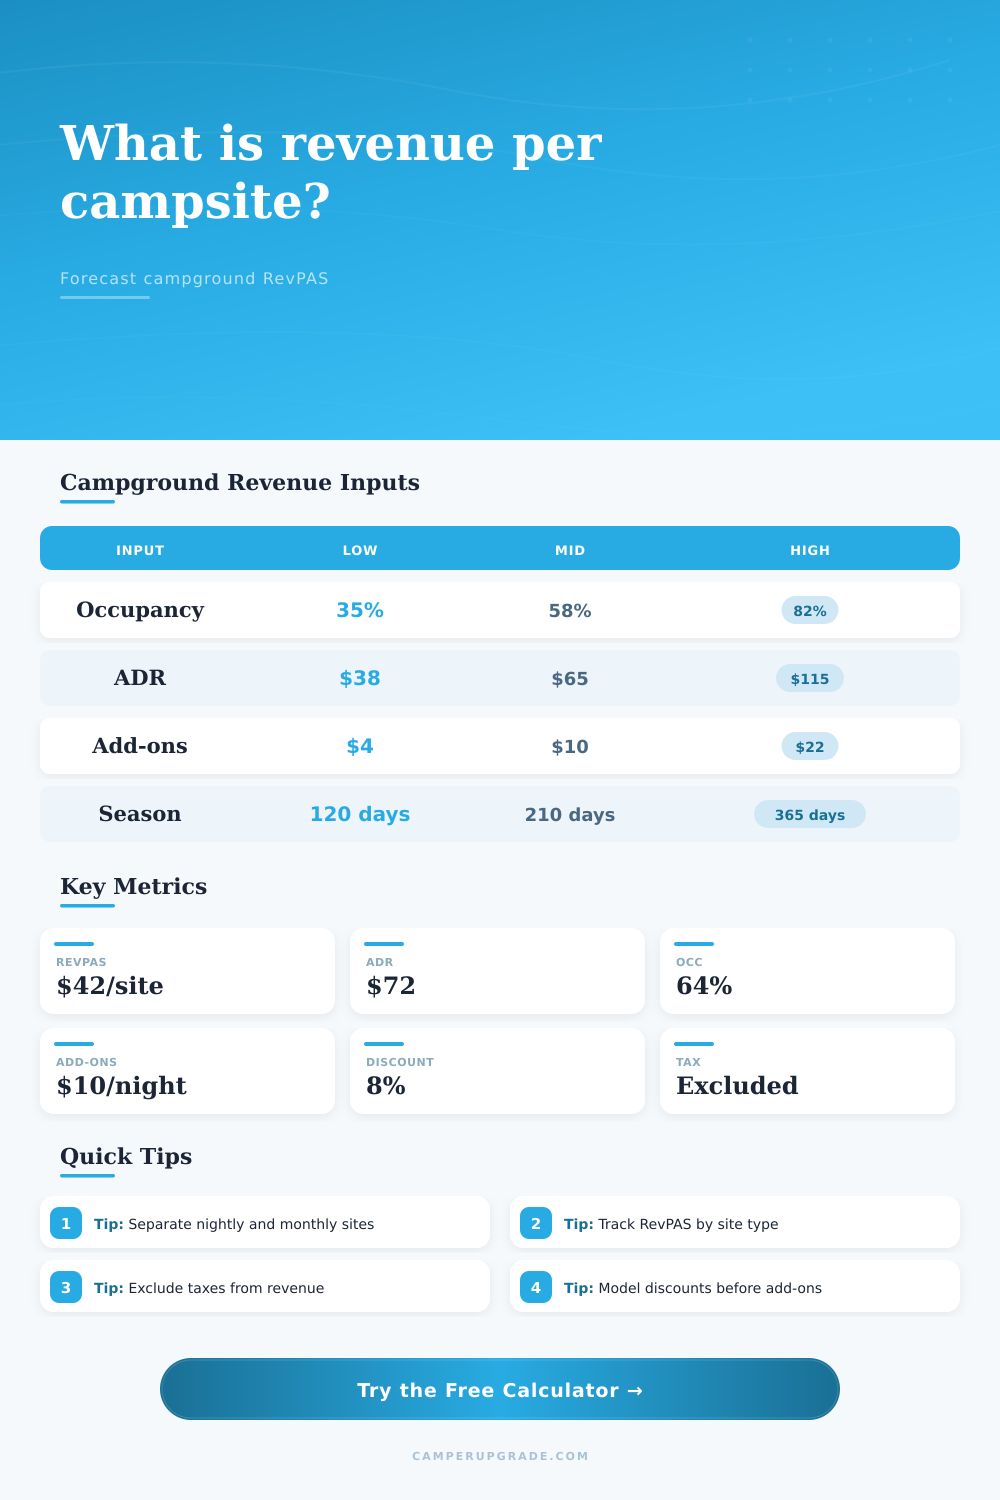
Forecast tax-excluded campground revenue from sites by type, nightly rates, occupancy, monthly and seasonal agreements, add-on revenue, discounts, operating days, ADR, and RevPAS.
🏕Revenue Presets
📅Operating Days And Revenue Rules
🛻Nightly Sites By Type
📝Monthly And Seasonal Sites
Revenue Breakdown
📊Current Mix Cards
🧮Scenario Comparison Grid
Base Forecast
$0Current rates, occupancy, discounts, monthly stays, seasonal stays, and add-ons.
Occupancy +10%
$0Same rates with nightly occupancy lifted by ten percent of current occupancy.
Rate +5%
$0Nightly, monthly, and seasonal rates increased while site counts stay fixed.
Add-ons +$5
$0Per occupied site night add-on revenue raised by five dollars.
📋Site Type Revenue Table
| Site type | Available sites | Rate input | Occupancy basis | Revenue role |
|---|---|---|---|---|
| Tent sites | Usually lower ADR, high weekend sensitivity | Nightly public rate | Occupied tent nights divided by tent site days | Good volume contributor when rates are lower. |
| Standard RV sites | Main inventory for many campgrounds | Nightly water and electric or full hookup rate | Standard RV occupancy percentage | Often drives the largest share of RevPAS. |
| Premium RV sites | Pull-through, patio, waterfront, or extra-large pads | Premium nightly rate | Premium occupancy percentage | Raises ADR when occupancy remains healthy. |
| Cabins or glamping | Cabins, yurts, safari tents, or rental trailers | Nightly unit rate | Occupied unit nights divided by unit days | Can lift revenue even with fewer available units. |
| Monthly sites | Long-stay guests billed by month | Monthly rate times billed months | Equivalent site nights from monthly billing days | Smooths demand outside peak transient nights. |
| Seasonal leases | Sites committed for a season or access period | Seasonal rate plus seasonal add-ons | Seasonal sites times access days | Stabilizes revenue but may lower daily ADR. |
📈ADR And RevPAS Benchmarks
| Metric | Formula | Use when | Watch out for |
|---|---|---|---|
| ADR | Total lodging and add-on revenue divided by occupied site nights | Comparing rate quality and guest spend | Monthly sites can lower ADR while improving stability. |
| RevPAS | Total revenue divided by all available site days | Comparing yield across mixed inventory | Closed days should be excluded only if the campground cannot sell them. |
| Occupancy | Occupied site nights divided by available site days | Checking volume and sell-through | High occupancy at heavy discounts can hide weak yield. |
| Add-on per occupied night | Per-night add-ons plus other add-ons divided by occupied nights | Measuring non-site revenue attachment | Tax collections and refundable deposits should stay out. |
📐Occupancy Planning Table
| Forecast layer | Typical input | Calculator treatment | Best use |
|---|---|---|---|
| Transient nightly | Sites, rate, occupancy percent | Sites times operating days times occupancy | Weekend, holiday, shoulder, and weekday pacing. |
| Monthly | Sites sold, monthly rate, months billed | Monthly revenue plus equivalent occupied site nights | Winter guests, workers, extended stays, and off-season base load. |
| Seasonal | Sites sold, seasonal rate, access days | Seasonal revenue plus seasonal occupied site nights | Annual or summer leases with committed inventory. |
| Add-ons | Revenue per occupied night and period amount | Added after lodging discount and before metrics | Store, firewood, rentals, activity passes, pets, and extra vehicles. |
🗂Revenue Preset Reference
| Preset | Operating days | Inventory shape | Revenue emphasis |
|---|---|---|---|
| Small Mixed Campground | 180 days | Tent, RV, premium, cabins, monthly, seasonal | Balanced transient revenue with moderate add-ons. |
| Lake Weekend Peak | 120 days | High premium occupancy and fewer long-stay sites | Peak-night rate quality and add-on capture. |
| Snowbird Monthly Park | 210 days | Heavy monthly occupancy with fewer cabins | Stable monthly revenue and lower transient exposure. |
| Seasonal Lease Heavy | 150 days | More leased seasonal sites than cabins | Committed seasonal revenue and predictable site use. |
📘Formula Notes
Nightly lodging revenue = sites x operating days x occupancy x nightly rate x (1 - discount percent).Total revenue = discounted nightly lodging + monthly revenue + seasonal revenue + add-on revenue, with taxes excluded.ADR = total revenue / occupied site nights. RevPAS = total revenue / available site days.
🧭Revenue Tips
Where did all that money go? Where’s the empty space on your campground loop? Yeah, you’ve got the Wi-Fi, you’ve got the hooks, but hey, you’ve also got the sites.
It’s nearly always a failure to distinguish between revenue and yield. Having a full campground dont necessarily make for good business when you ignore the add-ons or the rate. That’s what makes revenue per available site day so important… It gets you thinking about how efficient each and every square foot of land is.
Why Revenue Per Site Is More Important Than Occupancy
Once you input your site mix, occupancy rates and ancillary income, the above calculator do the complicated math for you. It removes the noise (taxes), and shows you your real operating revenue; what goes straight to your bank account.
Most owners only care about their occupancy percentage. Why? Because when their pads are full, they feel as if they’re doing a victory lap. And, sure, high occupancy is great. But often times high occupancy at a steep discount can hide weak yield. You could sell out every night at thirty dollars but the site may have cost you forty-five dollars in maintenance and usage costs.
That’s where the tool come in. This tool combines your seasonal and monthly leases with your nightly rates, this gives you a single view of the gap between your occupancy rate and your yield.
Stable operations rely on a backbone of seasonals and monthlys, particularly in shoulder seasons when transient demand evaporates. The great thing about them is the predictable cash flow used to cover fixed expenses like insurance and loan payments. The downside is that they lower your average nightly rate. A nine-hundred-dollar-a-month snowbird generates approximately thirty bucks a night. Compare that with an eighty-buck-a-night summer weekend warrior.
That’s what confuses folks. They’re freaked out by their ADR going down. What they ought to be looking at is Revenue Per Available Site. This take into account the guaranteed revenue generated by those long-term leases.
Add-on revenue is the silent multiplier in your forecast. Beyond the site fee, there’s firewood, propane refills, campstore sales, even pet fees, all of which add to the bottom line. And while they’re often considered incidental, they can adds ten to twenty dollars per occupied night. Add ’em into your model, and you’ll find that a guest night is worth a lot more than you thought.
With the calculator, you can enter those per-night add-ons separately and get a sense for how much extra cash each occupied pad brings to the bottom line. That will help determine whether it makes sense to invest in an upgraded Wi-Fi system, or a spiffier campstore. Is the guest experience worth the cost?
Be careful how you model discounts: discounts have both pros and cons. If you discount 10% off of advanced reservations, yes, this will fill up your calendar. But now you’ve cut your margin by 10% on all sales. The tool can give you a blended discount rate so that you know exactly what that discount means in terms of your overall revenue. Does the increase in volume from discounting offset the rate erosion? In most cases, keeping your higher rate but accepting a bit less occupancy result in more profits than discounting to a full calendar. Margins shrink and this can hurt profits much faster then having empty sites.
Even more valuable than that is what it teaches by way of comparison. Using its preset scenarios, you can compare a high-volume lake destination against a small mixed-use park and see that each type of inventory calls for a different strategy. Revenue can be higher but more unpredictable at a park with plenty of top-shelf waterfront spots. You get lower returns and steadier occupancy at a forest-side park with ordinary spots. Set some realistic targets once you understand the mix of inventory you’re working with.
If your property lends itself to tent camping, you’re not aiming to be a luxurios resort. You’re dialing in revenue potential based off the inventory you’ve got. The plan isn’t as much prediction as it is an experiment of your assumptions. If I increase my rate by $5, what will happen? If I lose 10% of occupancy, what will that do? These simulations help you prepare for the storm, for an economic downturn, etc. They take your vague anxiety and turn it into cold hard numbers.
How much money would you lose? Which actions could you take to offset it?
This isn’t just about making money. This is about creating a strong business, one that thrives during the busy season and survives the quiet times. Each occupied pad need to earn its keep, while each vacant pad represents a missed opportunity.