Campground Occupancy Rate Calculator
Estimate net campground occupancy from available sites, booked nights, maintenance blocks, no-shows, group-site capacity, monthly guests, and weekday versus weekend demand.
Occupancy results
| Net Occupancy | Typical Signal | Capacity Read | Operations Check |
|---|---|---|---|
| Under 45% | Soft demand | Open inventory most nights | Review weekday fill and shoulder dates |
| 45% to 65% | Moderate use | Weekends may be strong | Separate peak nights from slow nights |
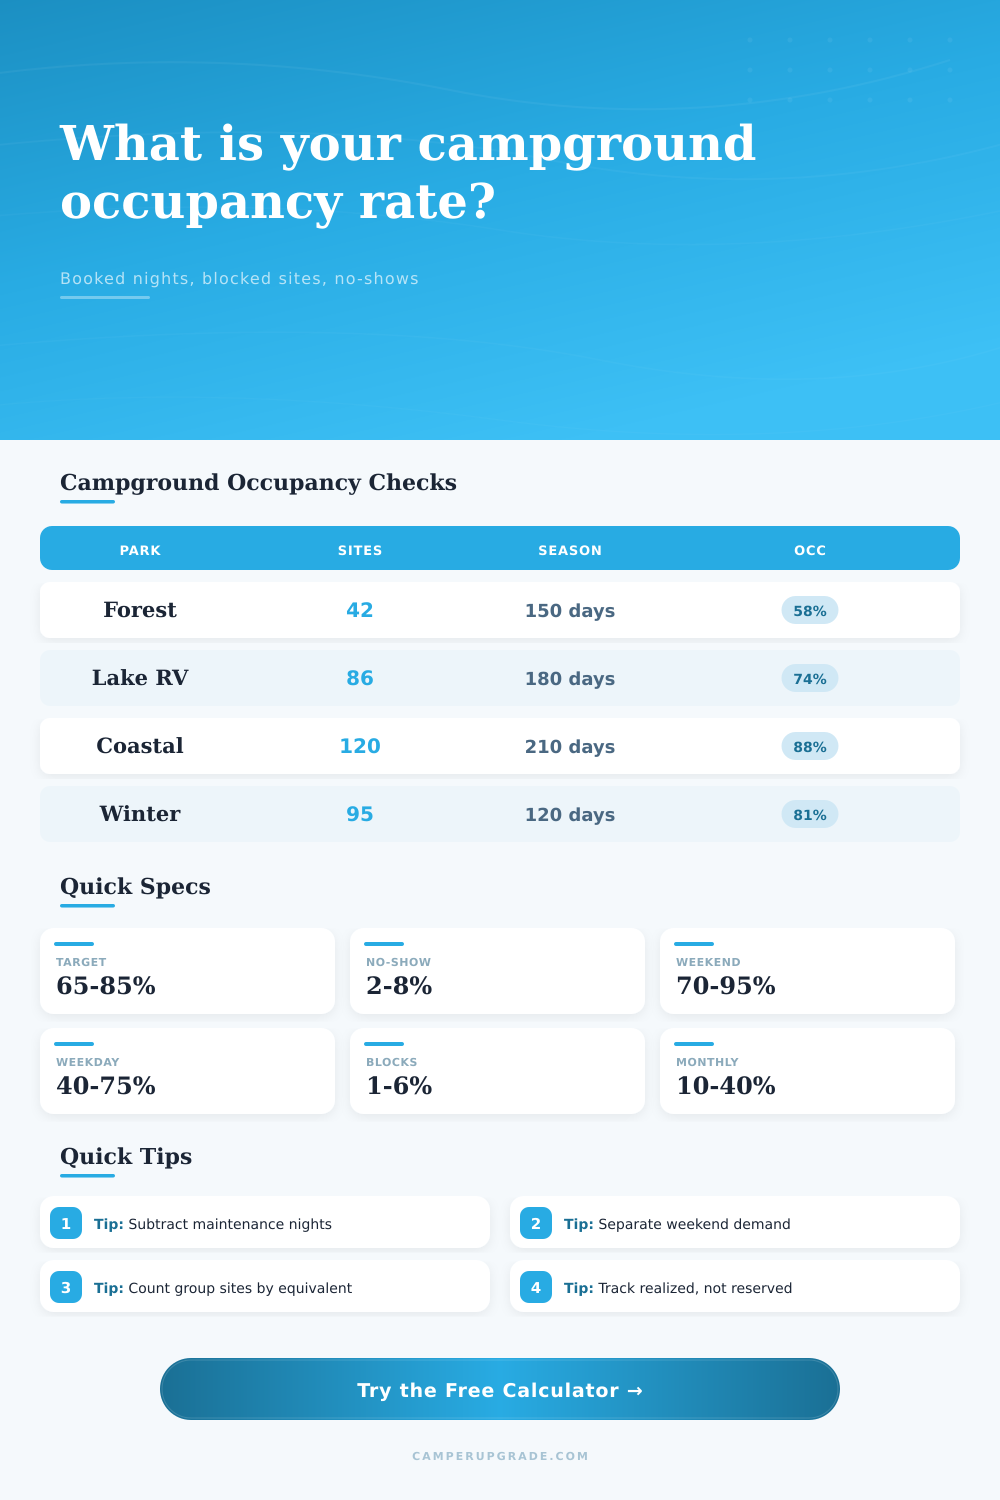
| 65% to 85% | Healthy occupancy | Balanced sellable capacity | Watch maintenance blocks and no-shows |
| Over 85% | Tight availability | Limited open site-nights | Protect repair windows and arrival flow |
| Split Pattern | Weekday Capacity | Weekend Capacity | What It Means |
|---|---|---|---|
| Standard 7-day week | 71.4% | 28.6% | Use for normal Monday through Thursday versus Friday and Saturday demand. |
| Holiday-heavy season | 66% to 70% | 30% to 34% | Shift more capacity to weekend nights when holidays extend demand. |
| Destination park | 60% to 68% | 32% to 40% | Longer stays can spread bookings beyond the weekend peak. |
| Local weekend park | 72% to 76% | 24% to 28% | Most pressure lands on Friday and Saturday site-nights. |
| Input | Raises | Lowers | Best Use |
|---|---|---|---|
| Available sites | Gross capacity | Rate if bookings stay flat | Use all reservable sites, not only booked sites. |
| Blocked nights | Blocked share | Net capacity | Subtract true maintenance and closure holds. |
| No-show rate | No-show nights | Realized occupancy | Use arrival records when possible. |
| Group equivalent | Weighted capacity | Standard-only comparison | Convert group areas to standard-site equivalents. |
| Monthly guests | Long-stay occupied nights | Open transient inventory | Count average in-season monthly site use. |
| Scenario | Sites | Season | Common Occupancy Driver |
|---|---|---|---|
| Forest Loop | 30 to 50 | 120 to 160 days | Weekend campers with weekday openings. |
| Family RV Park | 70 to 140 | 160 to 240 days | Mixed nightly, weekly, and monthly guests. |
| Coastal Peak Park | 90 to 180 | 180 to 260 days | High weekend demand and low vacancy. |
| Event Group Camp | 40 to 90 | 90 to 180 days | Group sites can change weighted capacity quickly. |
Occupancy rate is something campground owners think of as a hotel metric. Take the nights you’ve booked and divide them by the number of nights you can book. Let’s just hope that it’s a good number.
But that doesn’t account for mud in the driveway or dirt on the pad. Or those group reservation that block out four spots while only paying for one block. Getting more people to reserve a spot isn’t always the difference between full loops and an empty one; it’s knowing how many you have left to sell once you subtract all your blocked spaces and leaks.
How to Calculate Real Occupancy
First, set realistic limits on what you can do. A hundred-hookup oceanfront RV park is different from a 40-site woods loop. Once you establish those limits, the rest of the equation happens automaticly in that calculator (above).
It removes the guesswork about how many lost-nights should be excluded, which are counted as lost revenue vs. Are they considered protected infrastructure? Should they be included in the calculation? Subtract them. Otherwise, your occupancy number will appear better then it actualy is. But it’s also going to look like less strain on operations since only a fraction of your visitor will use the facilities. This makes it impossible to predict how much water, waste services, or staff you will need.
Demand on weekends differs significently from weekday demand. On Tuesdays, the local park may be at forty percent occupancy while on Saturdays it hit ninety percent. When you average these two figures, you get sixty-five percent, a healthy number. What it conceals is that Tuesdays barely pay for the electricity.
Pulling out those numbers can show you where the bucks come in: if you’re filling up on the weekends but struggling with midweek business, you don’t have a capacity issue; you have a placement issue. You need discounted midweek pricing or extended stay packages, not additional inventory.
To make matters more complicated, group sites take up room in ways different than individual family units. A big group spot can have 30 people on four regular-size spots. You could say that’s one site, which will jump your occupancy rate. Or four sites, which will drop your revenue per site. The answer is to apply some sort of equivalent multiplier. Call the group area like two or three regular units and suddenly you get a fair picture of both how physically packed you are and how financially full you are. You’re just making the wildness of groups getting together into something that allows you to compare with your peaceful, paid tent campers.
The other complication is long term guests. Monthly guest add a predictable load on utilities while providing consistent cash flow. More importantly, they take sites off the transient market for weeks or months. A park with sixty-four sites hosting eight monthlies has fifty-six site available for your nightly bookings. That’s an important number to ignore. By allowing you to enter your average number of monthly nights, it adjusts the denominator for your true sellable inventory.
The silent killer of campgrounds is no-shows. Sure, a 4% no-show rate doesn’t seem like much; until you consider it’s on your most valuable days: in peak season at your highest prices. The vacant spaces mean missed money that can never be earned through marketing after the fact. If you track realized occupancy instead of reserved occupancy, you’ll force yourself to reckon with the difference between intention and action.
In general, sixty-five to eighty-five percent is healthy occupancy. Anything below, and you’re pricing yourself too low, or leaving money on the table. Anything above, and you will be annoying customers (they want a quiet, clean experience) while wearing out your infrastructure. This page has a reference table that lays it out clearly: not only where you are, but what’s the next check you should of be running.
But at the end of the day, occupancy isn’t a trophy, it’s a diagnostic tool. It lets you know whether or not you’re pricing appropriately for your supply level. It lets you know whether or not your marketing connects with the proper audience. And it lets you know whether or not your maintenance schedule caters to your booking patterns.
Once you quit chasing the high number, and instead begin dissecting what goes into creating that number, you stop guessing. You run a business. And that clarity is worth far more then a full house on a weekend.