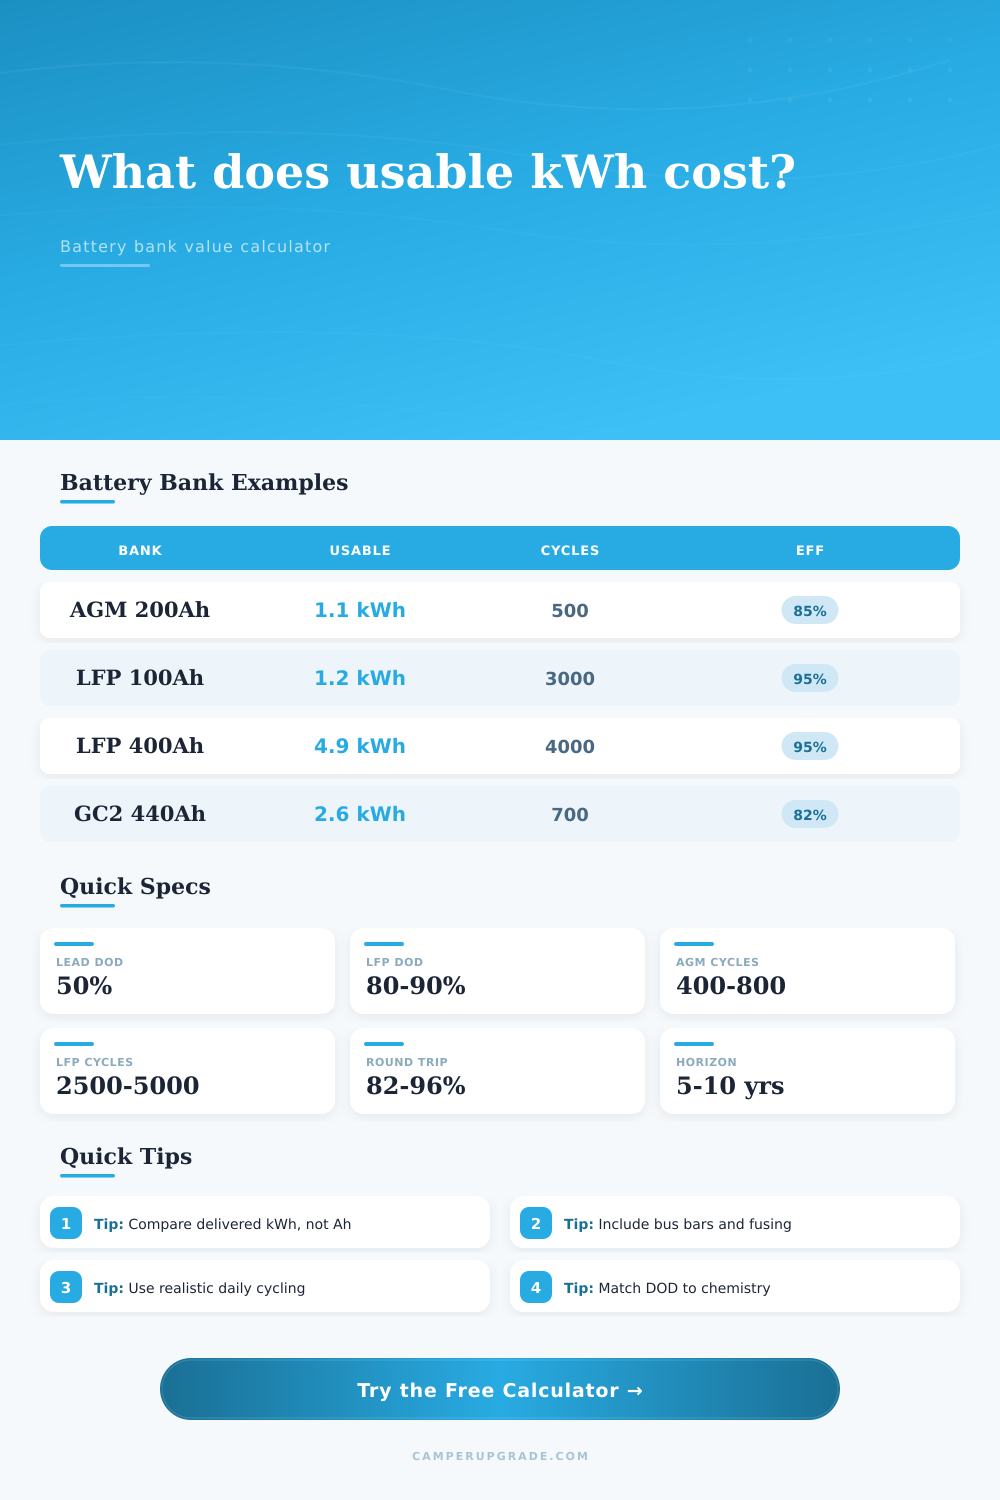
Battery Bank Cost per Usable kWh Calculator
Compare nominal capacity, usable depth of discharge, efficiency losses, cycle life, parallel strings, accessory allowance, and replacement horizon in one bank model.
Bank value results
Lower usable kWh protects plate life and keeps voltage sag manageable.
Useful for simple sealed banks, but heavy daily cycling raises replacement count.
High efficiency makes more of the nameplate capacity count as delivered energy.
Cycle life can dominate long-horizon cost when the camper is used often.
| Chemistry | Typical usable DOD | Round-trip efficiency | Cycle life planning range | Value note |
|---|---|---|---|---|
| Flooded deep-cycle lead acid | 45-50% | 75-85% | 400-900 cycles | Low entry cost, more ventilation and maintenance. |
| AGM lead acid | 50-60% | 80-88% | 400-800 cycles | Sealed and simple, but cost per delivered kWh can climb. |
| Gel lead acid | 50-60% | 80-87% | 500-1000 cycles | Sensitive to charge profile, often used where spill risk matters. |
| LiFePO4 | 80-90% | 92-96% | 2500-5000 cycles | Higher purchase price, strong usable capacity and cycle value. |
| Sodium-ion | 75-85% | 88-93% | 2000-4000 cycles | Emerging option; verify low-temperature and BMS specifications. |
| Battery bank | Nominal kWh | DOD and efficiency | Reserve | Estimated usable kWh |
|---|---|---|---|---|
| 12V 200Ah AGM pair | 2.40 kWh | 55% DOD, 85% eff. | 5% | 1.07 kWh |
| 12.8V 100Ah LiFePO4 | 1.28 kWh | 90% DOD, 95% eff. | 5% | 1.04 kWh |
| 12.8V 400Ah LiFePO4 | 5.12 kWh | 90% DOD, 95% eff. | 5% | 4.16 kWh |
| 24V 100Ah LiFePO4 | 2.56 kWh | 85% DOD, 95% eff. | 5% | 2.07 kWh |
| 48V 100Ah inverter bank | 5.12 kWh | 85% DOD, 94% eff. | 7% | 3.80 kWh |
| Use pattern | Full cycles/year | 500-cycle lead bank | 3000-cycle LFP bank | What it changes |
|---|---|---|---|---|
| Occasional camping | 30 | 16.7 years | 100 years | Calendar age may matter before cycle count. |
| Long weekends | 75 | 6.7 years | 40 years | Lead replacement enters a 10-year horizon. |
| Seasonal travel | 150 | 3.3 years | 20 years | Cycle life becomes a major value driver. |
| Full-time boondocking | 300 | 1.7 years | 10 years | Delivered kWh cost matters more than purchase price. |
| Allowance | Typical included items | Best fit | Bank size signal |
|---|---|---|---|
| 8-12% | Terminals, short cables, hold-down hardware | Drop-in replacement with existing protection | Single battery or small parallel pair |
| 15-25% | Fuse, bus bars, cable, lugs, disconnect | Common camper upgrade with safer wiring | 200-400Ah at 12V |
| 25-40% | Monitor, shunt, Class T fuse, larger cables | High-inverter draw or enclosed lithium install | 400Ah+ or 24V/48V systems |
| 40%+ | Heated case controls, DC-DC changes, enclosure | Cold-weather or system redesign projects | Custom vans and extended off-grid builds |
Accessory allowance is intentionally separated from battery price so you can compare cells, finished batteries, and install hardware without hiding the wiring cost.
Perhaps you’ve glanced at the sticker price on a lithium battery pack and thought, “that’s too pricey for something I could get in a lead acid.”
This is nearly always a false equivalency as you’re measuring nameplate capacity vs. Real-world usable energy. The cost is actualy measured in the gap between what a battery holds on paper versus what you get back out of it. What you get back out of it when it’s loaded up.
Why Lithium Batteries Are Worth the Extra Cost
This isn’t simply about amp-hours and voltage, this is about storing chemical energy and having some fraction of that survive the round trip charge to discharge. Depth of discharge are essentially a measure of how far you can push the chemistry before it dies. Because lead-acid batteries likes to be topped up, keeping them around 50% will prolong their lives. LiFePO4 (lithium iron phosphate) batteries is less picky about being discharged down to eighty or ninety percent and won’t suffer to much degradation that way.
Sure, that extra slice of usable sounds small on its own. But multiply that by thousands of cycle and the effects compound. The calculator does all this math for you after you enter in your targets for efficiency and cycle life along with battery’s voltage. That eliminates having to fiddle with each efficiency point loss.
The other quiet cost is efficiency. Many installer don’t consider this until the winter bills come. No matter what the battery, there’s no getting back what you didn’t put into it. Batteries can only accepts so much charge, they generate heat and they lose energy through internal resistance. If all you get out of a battery is eighty-five percent of what you stored, then you’re essentially wasting fifteen percent as heat. Lithium batteries reaches up to ninety-five percent (or better) efficiency.
In other words, you’ll have more of your solar harvest running your fridge and lights. The difference in efficiency changes how much solar array you can afford to build and how frequently you need to run your generator.
And then there’s the hardware required to make the bank function. Battery monitors, heavy-gauge cabling, fuses, and bus bars aren’t accessories, they’re the safety net that protects you from turning your van into a fire hazard with a short circuit. A good accessory allowance helps ensure you’re looking at apples to apples; i.e., total installed cost vs. Only cell prices. You might be surprised how much overhead goes into this stuff, especially when you get the roll of two-gauge wire in your hand and realize “oh crap, it was more then I thought”.
The long-term goal is cycle life. The longer term cost is in cycle life. Although the sticker price may be higher, a 10-year battery will ultimately save money over one with a lower price but a shorter life expectancy (three years). So what’s your full-cycle-per-year expectation? Is it one cycle a day, as in boondocking all the time? Or maybe you camp part-time, just weekends so calendar age is more important than cycle count. That changes things. And that’s where the table on the page comes in. It shows which use patterns affects the delivered cost per kilowatt-hour and how they shift the horizon for replacement.
Reserve capacity is your handy-dandy insurance policy. The idea is that you don’t want to deplete your battery completely down to zero. There’s always a chance your inverter will spike to get a refrigerator or air conditioner compressor cranking, or maybe you’re running down a cold night and lose some charge due to the temperature. Reserving a few percent of capacity gives you a buffer for those what-ifs that is bound to happen. If not, then you’ll be sitting out there on that rural road somewhere with a stone-cold battery.
After all, you’re not purchasing the least expensive battery. You’re purchasing the lowest cost per usable kilowatt-hour for the duration of the system’s life. Take into account factors like depth of discharge, cycle life, and efficiency. Sometimes the numbers says something different than what the price says. You are buying an investment in delivering energy, not just storing it. So that mindset shifts everything.