Solar Charge Time By Cloud Factor Calculator
Estimate how long your RV solar array needs to move a battery bank from its current state of charge to your target when clouds, controller losses, battery chemistry, and always-on loads are included.
⚡Real RV Solar Presets
🔋Battery, Solar, And Cloud Inputs
Solar Recharge Results
⚙Solar And Battery Spec Comparison Grid
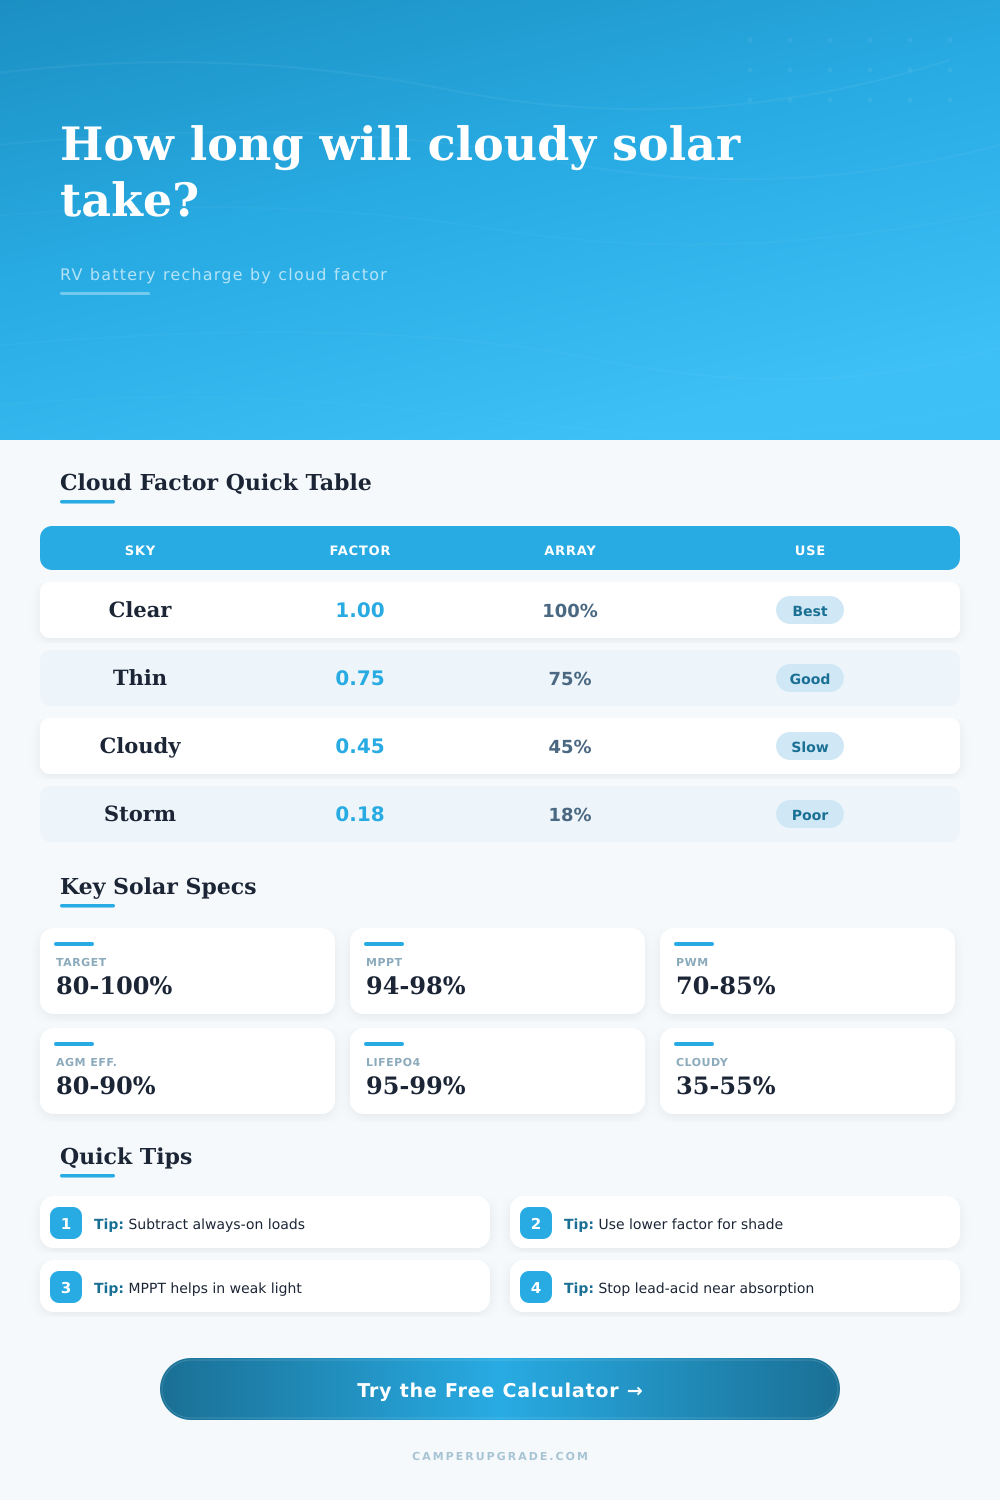
☁Cloud Factor Reference Table
| Sky Condition | Suggested Cloud Factor | Typical Panel Output | Calculator Use |
|---|---|---|---|
| Clear sky, panels clean, good sun angle | 1.00 | 90% to 100% before derates | Use for direct sun forecasts and open desert camps. |
| Thin high cloud, light haze, wildfire smoke edge | 0.75 to 0.85 | 65% to 85% of clear output | Use when shadows are faint but visible. |
| Broken cumulus with sun breaks | 0.55 to 0.70 | 45% to 70% of clear output | Use for mixed sun and moving cloud cover. |
| Bright overcast with no direct shadow | 0.35 to 0.55 | 30% to 55% of clear output | Use for gray but bright travel days. |
| Dark overcast, rain cloud, dense forest edge | 0.12 to 0.28 | 10% to 30% of clear output | Use for conservative wet-weather planning. |
📊Daily Solar Yield By Array Size And Cloud Factor
| Array Size | Clear Day At 5 Sun Hours | Bright Cloud Factor 0.50 | Dark Cloud Factor 0.20 |
|---|---|---|---|
| 200 W portable suitcase | 1,000 Wh raw harvest | 500 Wh before losses | 200 Wh before losses |
| 400 W compact RV roof array | 2,000 Wh raw harvest | 1,000 Wh before losses | 400 Wh before losses |
| 600 W travel trailer array | 3,000 Wh raw harvest | 1,500 Wh before losses | 600 Wh before losses |
| 900 W fifth wheel array | 4,500 Wh raw harvest | 2,250 Wh before losses | 900 Wh before losses |
| 1,200 W large boondock array | 6,000 Wh raw harvest | 3,000 Wh before losses | 1,200 Wh before losses |
🔌Controller And Battery Efficiency Table
| Component Or Chemistry | Typical Efficiency | When It Matters Most | Calculator Setting |
|---|---|---|---|
| PWM controller with 12 V nominal panel | 78% to 84% | Small arrays and matched-voltage panels | Choose PWM matched if panel voltage is close. |
| MPPT controller with series roof panels | 94% to 98% | Cold mornings, high panel voltage, variable cloud | Choose MPPT warm or high quality. |
| Flooded lead-acid house bank | 80% to 88% | Charging above about 80% state of charge | Use flooded lead-acid or older bank. |
| AGM deep-cycle house bank | 86% to 92% | Weekend recovery and moderate charge rates | Use AGM healthy bank. |
| LiFePO4 house bank | 95% to 99% | Large solar arrays and high daily cycling | Use LiFePO4 flat charge curve. |
🏕Common RV Solar Recovery Examples
| RV Scenario | Battery Deficit | Array And Sky | Approximate Recovery |
|---|---|---|---|
| Van after one laptop and fridge night | 45 Ah at 12 V | 300 W, clear, MPPT | About 2 to 3 strong sun hours |
| Travel trailer after furnace-heavy night | 110 Ah at 12 V | 400 W, bright overcast | Usually more than one short winter day |
| Fifth wheel with residential fridge load | 210 Ah at 12 V | 900 W, broken clouds | Often one long shoulder-season day |
| Truck camper parked under thin tree shade | 55 Ah at 12 V | 200 W suitcase, partial shade | May need moving panels during the day |
| Large lithium bank after induction cooking | 180 Ah at 12 V | 1,200 W, clear to thin cloud | Often recovered before late afternoon |
💡Charging Notes For Better Estimates
The amount of solar power you get vary with sky conditions. One day you could get strong output; another, it’s cloudy, so output is weak. Equipment isn’t normaly the cause of that difference. That’s just how much light was available.
The calculator connect the dots from what you expect to what you got. It translates unclear weather condition into a numeric number of hours waiting. When many owner install a panel, they figure it’s generating its stated wattage every hour of the day. But if sky is cloudy, it might output just half as much.
How the Solar Calculator Works
This calculator accounts for that by applying a cloud factor to your hardware rating. Selecting a sky condition from the list adjust the projected harvest to match. Rather than guess, it employs tried-and-tested multipliers that represent amount of light that gets through various kinds of cloud cover. Dark stormy clouds differ from bright overcast. By allowing you to choose which prediction aligns with what’s coming your way, it ensure that you’re not planning for sunny conditions where gray skies is in store.
Solar predictions are reduced by efficiency losses as well. Panels don’t work as well when hot. Wires has resistance. Charge controllers convert voltage (and use some of it). Before computing charging time, the calculator will deduct these real-world losses. An MPPT controller retain more power under varying light conditions than an old-school PWM setup. If you put in what hardware you’re using, then the math is based off how your rig works. It does not assume a perfect system that do not exist in real life.
Sunlight isn’t all that matters; battery chemistry does too. Most lithium batteries can be charged throughout most of their capacity. They’ll even suck it in during a cloud day. A lead-acid battery slow down dramatically as it fills (especially after 80% charged). On a cloudy day topping out an old flooded bank can leave the solar trickle barely covering the battery’s internal resistance. The calculator include this acceptance curve so you can tell whether you’re actualy charging the battery or merely powering your appliances.
And then there’s the background load. There’s that fridge compressor running. That is an idling inverter. There is that blinking router. All of those watts comes off your battery, and if they’re not accounted for in your estimate, you’ll underestimate how long it takes to top off. So you’re not simply filling up a battery; you’re combating leakage and topping it off at the same time. Once you plug in your average idle consumption, the tool automaticly accounts for this wattage.
You also want to add some wiggle room in your energy plan. Weather doesn’t always cooperate perfectly. If clouds stay longer than anticipated, add an extra 10% or 20% to what you think you need. That way you can account for error without running out of juice on day three when you didn’t get perfect weather as predicted.
That’s not being negative. That’s acknowledging the physical reality of weather, the fact that sunlight is an unsteady energy source. Once you recognize how much less light cloudy days give you, you’ll no longer fight the weather; you’ll plan with it. You’ll let the numbers lead you to a realistic plan rather than a hopeful one.