Descent Time Calculator
Estimate how long a hiking descent will take after distance, elevation loss, trail surface, steepness, pack load, fatigue, stops, group pace, and daylight margin are included.
🧭Downhill Route Presets
📐Route And Hiker Inputs
🥾 Descent Time Results
⚙Terrain Adjustment Grid
📊Reference Tables
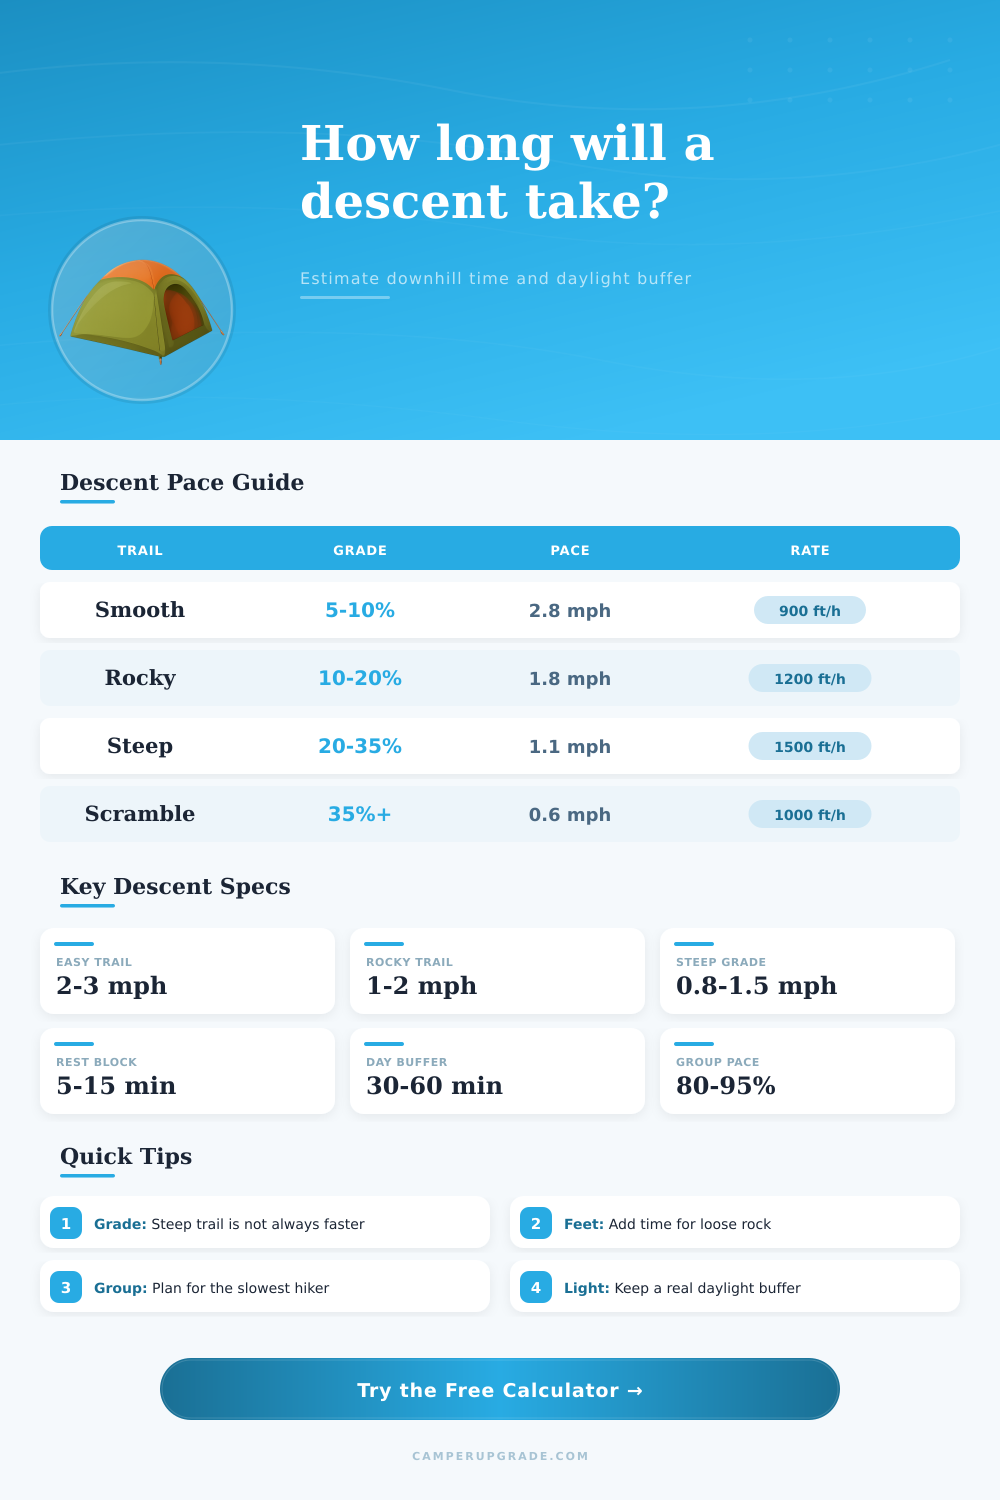
| Descent Terrain | Typical Downhill Pace | Typical Vertical Rate | Planning Note |
|---|---|---|---|
| Smooth graded trail | 2.5 to 3.5 mph | 600 to 1000 ft/hr | Gentle downhills can be faster than flat walking |
| Normal forest trail | 1.8 to 2.8 mph | 800 to 1400 ft/hr | Roots and turns slow the average |
| Rocky mountain trail | 1.2 to 2.0 mph | 900 to 1600 ft/hr | Foot placement matters more than fitness |
| Loose scree descent | 0.8 to 1.6 mph | 1000 to 1800 ft/hr | Fast vertical loss but slower horizontal travel |
| Talus or boulder field | 0.4 to 1.0 mph | 500 to 1100 ft/hr | Balance and route choice dominate timing |
| Average Grade | Trail Feel | Speed Effect | Descent Planning Use |
|---|---|---|---|
| Under 5% | Almost flat | Small speed gain | Distance controls the estimate |
| 5% to 10% | Comfortable downhill | Often fastest zone | Good for smooth switchbacks |
| 10% to 20% | Noticeable descent | Neutral to slower | Most hiking descents land here |
| 20% to 35% | Steep trail | Slower and more careful | Use poles, stops, and more buffer |
| Over 35% | Very steep or technical | Much slower | Surface and exposure control time |
| Pack And Fatigue | Suggested Factor | When To Use It | Result Effect |
|---|---|---|---|
| Light daypack under 10 lb | 0% to 3% slower | Short return hike | Mostly unchanged pace |
| Normal daypack 10 to 25 lb | 3% to 8% slower | Water, layers, camera, food | Small but real slowdown |
| Overnight pack 25 to 45 lb | 8% to 18% slower | Backpacking descent | Balance and knees matter |
| Tired legs after climb | 10% to 20% slower | Hot day or long summit push | Add stops and caution buffer |
| Sore knees or careful group | 20% to 35% slower | Protective downhill steps | Use conservative arrival time |
| Route Example | Distance | Elevation Loss | Typical Time Range |
|---|---|---|---|
| Short viewpoint return | 1.5 mi | 600 ft | 35 to 55 min |
| Forest ridge trail | 3.0 mi | 1200 ft | 1 hr 15 min to 2 hr |
| Rocky summit descent | 4.5 mi | 2600 ft | 2 hr 15 min to 3 hr 30 min |
| Backpacking pass exit | 6.0 mi | 3000 ft | 3 hr to 5 hr |
| Talus basin and trail | 3.5 mi | 1800 ft | 2 hr 30 min to 4 hr |
💡Descent Planning Tips
When hiking downhill, you find yourself moving slower then when hiking uphill, it’s not due to tired legs; getting off a mountain trail always seem to take longer than climbing up. You’re slowed by loose rock, steep grades, and a heavy pack. Even with gravity helping you, much of the time is lost because you misestimate how long it would take to get down at your normal speed on flat trails. You only realize this when you are still moving as darkness falls.
The beginning of every calculation is distance and elevation loss. On paper, two-thousand-feet of drop over three-miles sounds easy: but your actualy speed depends on how steep the grade is and what surface it is like, right? But what does it feel like when you’re going down hill? If the terrain is gentle (less than a 10% slope), you’ll be able to cover more ground then if the hike was along flat ground. Beyond this, the steeper the hill get (above 20%), the slower you have to place your feet and the slower you’ll go.
Why Going Downhill Takes So Long
Once you input your trail condition and number of miles, the calculator do the math for you; no more guessing about how much each grade change will cost you. Most of all, it is the surface. You can maintain your cadence on a well-worn trail through the woods; you must stop for balance and shorten your stride around wet roots and rocky trail section. Boulders and talus fields makes you take even smaller steps and pause more frequently to decide which direction your next foot should goes. By varying the surface options within tool, you can account for those variations while not having to lug an additional pace chart with you.
Other factors can influence these numbers, pack weight and tiredness can be underestimated. For example, a 10-pound daypack won’t realy impact your cadence. But if you have just completed a long climb and/or need to add in an overnight load, your knees will lose control and your balance will make you descend at a reduced speed. This change is what fatigued settings is accounting for; it’s even more critical if you’re descending late in the day with a group of hikers who move at different paces.
The other hidden time sink is in stopping. A few minutes for water breaks and pausing for photos add up over a few miles. Unplanned stops are even harder to predict, such as when someone adjusts their gear or waits for the group. With the rest input, you can plug those pauses into estimate before hitting the trail.
And finally, many people consider daylight margin an optional metric. This measures how much time is left until end of the day’s useful light and will tell you if your expected finish time allows for some leeway. A negative/very slim buffer means the estimate is telling you that you should of decrease your stops or get going earlier instead of assuming the trail will be easy when it gets dark.
But the beauty of running the numbers is that it makes you aware of what is realy controlling your day. What you saved on a smooth stretch may be erased by a tired group member or a short talus section. When you get to see how those pieces add up, you can make the little adjustments (shorten the route or leave earlier), that ensure the descent stays predictable rather than rushed.