Map Scale Distance Calculator
Convert a measured line on a paper map, PDF, trail guide, or route sketch into ground distance, adjusted hiking distance, effort distance, and a map-reading error band.
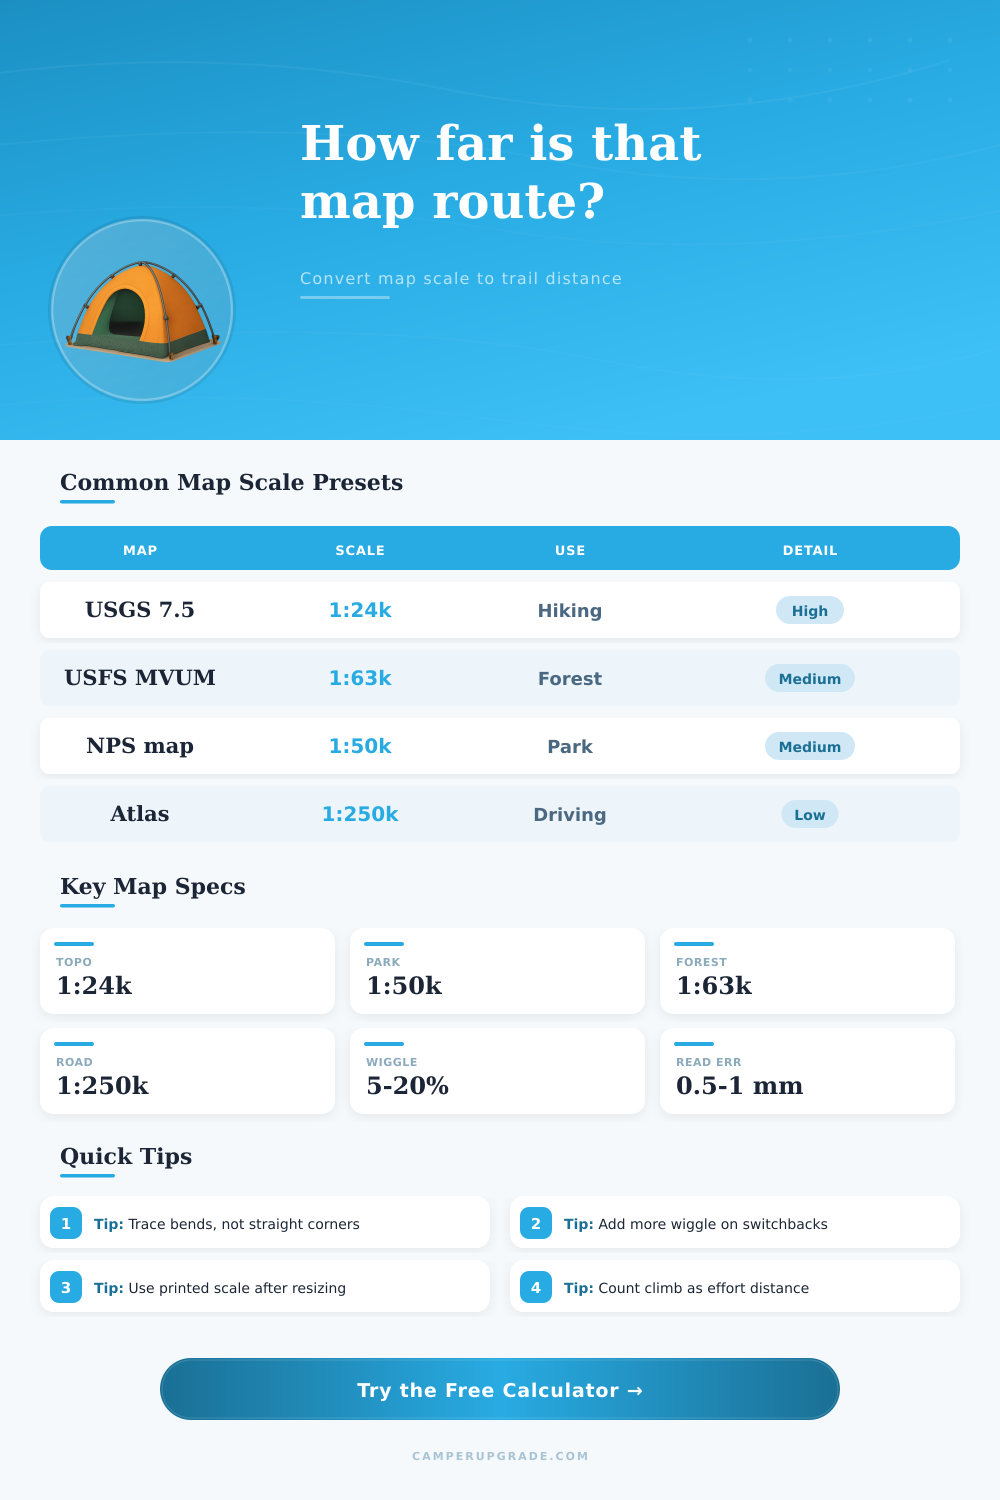
🗺Map Scale Presets
📏Route Measurement
Map Distance Results
🧭Map / Spec Comparison Grid
📚Common Scale Reference
| Map type | Typical scale | 1 cm on map | 1 inch on map | Best use |
|---|---|---|---|---|
| Orienteering race map | 1:10,000 | 100 m / 0.06 mi | 254 m / 0.16 mi | Precise foot navigation |
| USGS 7.5 minute topo | 1:24,000 | 240 m / 0.15 mi | 610 m / 0.38 mi | Hiking and backcountry routes |
| National park trail map | 1:50,000 | 500 m / 0.31 mi | 1.27 km / 0.79 mi | Park routes and shuttle planning |
| USFS motor vehicle map | 1:63,360 | 634 m / 0.39 mi | 1.61 km / 1.00 mi | Forest road distance checks |
| Overview topo map | 1:100,000 | 1.00 km / 0.62 mi | 2.54 km / 1.58 mi | Long route overview |
| Road atlas panel | 1:250,000 | 2.50 km / 1.55 mi | 6.35 km / 3.95 mi | Driving and access roads |
📈Terrain Factor Guide
| Route condition | Contour factor | Wiggle factor | When to use it | Planning note |
|---|---|---|---|---|
| Straight road or levee | 0-3% | 0-5% | Road line is easy to follow | Little extra distance beyond scale |
| Moderate maintained trail | 5-10% | 5-12% | Trail bends around terrain | Good default for topo maps |
| Switchback climb | 10-20% | 12-25% | Many bends are simplified on map | Trace the full trail if visible |
| Shoreline or canyon route | 12-25% | 15-30% | Route follows irregular landform | Small curves add up quickly |
| Off-trail contouring | 20-40% | 15-35% | Actual path works around obstacles | Use conservative estimates |
🔍Map Error Band Reference
| Reading error | At 1:24,000 | At 1:50,000 | At 1:100,000 | At 1:250,000 |
|---|---|---|---|---|
| 0.25 mm | ±6 m | ±13 m | ±25 m | ±63 m |
| 0.5 mm | ±12 m | ±25 m | ±50 m | ±125 m |
| 1.0 mm | ±24 m | ±50 m | ±100 m | ±250 m |
| 1.5 mm | ±36 m | ±75 m | ±150 m | ±375 m |
| 2.0 mm | ±48 m | ±100 m | ±200 m | ±500 m |
🧮Worked Examples
| Example route | Map measure | Scale | Ground distance | Adjusted planning distance |
|---|---|---|---|---|
| Trail from topo map | 12 cm | 1:24,000 | 2.88 km / 1.79 mi | 3.3-3.6 km with bends |
| Park map loop | 8 cm | 1:50,000 | 4.00 km / 2.49 mi | 4.5-5.0 km with wiggle |
| Forest access road | 3 in | 1:63,360 | 4.83 km / 3.00 mi | 5.0-5.4 km if winding |
| Road atlas segment | 2 in | 1:250,000 | 12.7 km / 7.89 mi | Use road signs for final check |
💡Map Reading Tips
When planning a route on paper, the distances on the map often represent a shorter distance on the ground. This is due to the fact that maps represents only a simplified version of the terrain. The line on the map that the traveler must take is simply a simplification of the route that must be took on the ground.
The difference between the distance on the map and the actual trail that must be traveled must be accounted for in route planning in order to avoid any planning mistake. One of the primary variables to consider in route planning is the map scale. The map scale will determine how much distance on the paper map represent distance on the ground.
Why map distances are shorter than the real trail
For example, a 1:24,000 map scale means that every centimeter on the map represents 240 meter on the ground. The ground distance that is represented on the map is often not the distance that must be traveled on the ground. The actual trail that is often taken often take travelers over hills and around rivers rather than traveling in straight line on the map.
The contour factor in the calculator accounts for this extra distance that is required to travel over hills or around rivers. A route that include maintained trails along moderate hills will require less distance to be added to the map distance than a route that requires individuals to travel off-trails and around obstacles like cliffs and drainages. The wiggle factor accounts for the fact that the line on the map is a simplification of the trail that is to be traveled on the ground.
For instance, switchbacks on a hill are represented as a single curve on the map which hide the distance that must be traveled on the ground. To account for this distance, a wiggle percentage is applied to the map distance. Not all maps has the same wiggle percentage.
For instance, a map of forest service roads will have a low wiggle percentage compared to a faint climber’s trail on a 1:50,000 scale map. A third factor in the equation is the elevation gain. This factor introduces the element of how much effort is required to travel up hills.
The calculator can convert the elevation gain into an equivalent distance that can be represented on the ground that is level with the individual. This distance can then be accounted for in the final calculation of distance and effort. For instance, every hundred meters of elevation gain require the same energy as eight hundred meters of level travel.
The fourth factor is the reference tables on the page. Many people often ignore this factor when planning routes. However, when individuals use a ruler to measure the distance on the map, it is unlikely that the ruler will land on the center of the printed line of the trail on the map.
This can introduce an element of uncertainty in the distance that is measured. The resolution setting in the calculator accounts for this distance band. At fine scale it will represent a narrow distance band, while at coarse scales the distance band will be much wider.
The distance band can help travelers to determine if the route that is being considered is safe or another route should be taken. The reference tables will assist individuals in setting the calculator to the correct settings for there map. The reference tables will show individuals the level of detail of maps of different categories.
For instance, the detail in a USGS 7.5-minute sheet is different than that of a brochure of a national park. These reference tables will help individuals to understand the details of the map that they are using for there route planning. Additionally, the terrain factor table will allow them to determine the effort required for different conditions on the route.
Each condition on the route will have a percentage associated with the terrain factor that can be select on the calculator. Many individuals make mistakes when planning their routes on paper. Some of the most common mistakes are treating the line on the map as the distance that is to be traveled on the ground and not accounting for the distance that is required to travel over hills and around rivers.
Other mistakes include failing to account for the fact that maps can change size when they are copied.